Tropict is a set of python and R scripts that adjust the globe to make land masses in the tropics fill up more visual real estate. It does this by exploiting the ways continents naturally “fit into” each other, splicing out wide areas of empty ocean and nestling the continents closer together.
All Tropict scripts are designed to show the region between 30°S and 30°N. In an equirectangular projection, that looks like this:
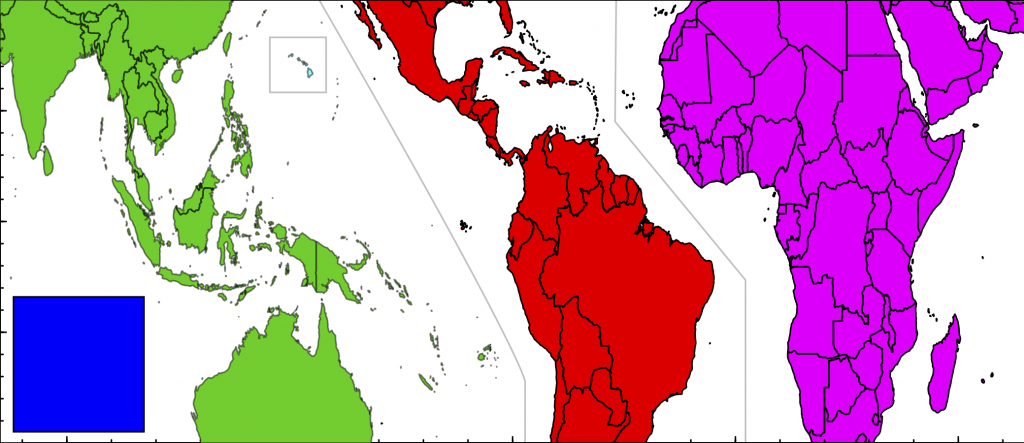
It is almost impossible to see what is happening on land: the oceans dominate. By removing open ocean and applying the Gall-Peters projection, we get a clearer picture:
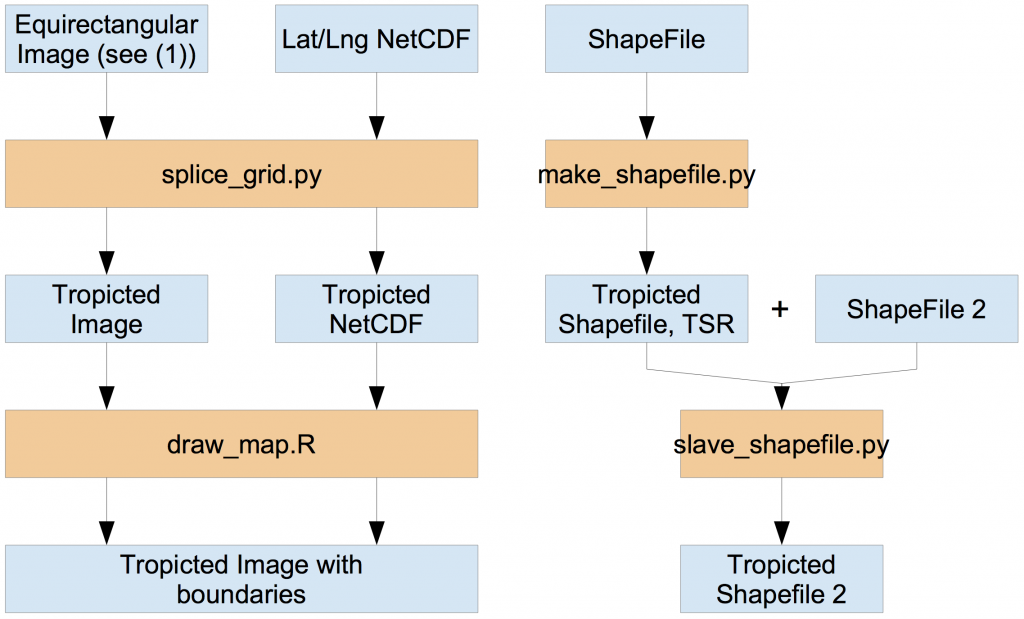
There’s even a nice spot for a legend in the lower-left! Whether for convenience or lack of time, the tools I’ve made to allow you to make these maps are divided between R and Python. Here’s a handy guide for which tool to use:

(1) Supported image formats are listed in the Pillow documentation.
(2) A TSR file is a Tropict Shapefile Reinterpretation file, and includes the longitudinal shifts for each hemisphere.
Let’s say you find yourself with a NetCDF file in need of Tropiction, called bio-2.nc4. It’s already clipped to between 30°S and 30°N. The first step is to call splice_grid.py to create a Tropicted NetCDF:
python ../splice_grid.py subjects/bio-2.nc4 ../bio-2b.nc4
But that NetCDF doesn’t show country boundaries. To show country boundaries, you can follow the example for using draw_map.R:
library(ncdf4)
library(RColorBrewer)

## Open the Tropicted NetCDF
database <- nc_open("bio-2b.nc4")
## Extract one variable
map <- ncvar_get(database, "change")

## Identify the range of values there
maxmap <- max(abs(map), na.rm=T)

## Set up colors centered on 0
colors <- rev(brewer.pal(11,"RdYlBu"))
breaks <- seq(-maxmap, maxmap, length.out=12)

## Draw the NetCDF image as a background
splicerImage(map, colors, breaks=breaks)
## Add country boundaries
addMap(border="#00000060")
## Add seams where Tropict knits the map together
addSeams(col="#00000040")
Here’s an example of the final result, for a bit of my coffee work:
For more details, check out the documentation at the GitHub page!
And just for fun, here were two previous attempts of re-hashing the globe:
I admit that moving Australia and Hawaii into the India Ocean was over-zealous, but they fill up the space so well!
Here I can still use the slick division between Indonesian and Papua New Guinea and Hawaii fits right on the edge, but Australia gets split in two.
Enjoy the tropics!


0 responses so far ↓
There are no comments yet...Kick things off by filling out the form below.