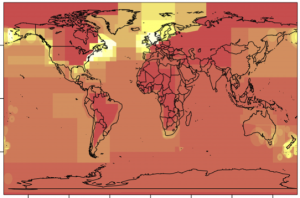
As part of my Marine Protected Area analysis, I constructed spatial boundaries for the data in the RAM Legacy database, a global database of stock assessments.
A dropbox with the spatial regions is available here:
The contents are as follows:
- latlon.csv: The “raw” data, with an encoding of the polygons for each RAM region
- reglocs.csv: Area and centroid location for each region
- shapes/ram.*: A shapefile for the RAM regions (polygons map to lines in latlon.csv)
- load_areas.R: A bunch of useful functions for interpreting the data in latlon.csv
- genshape.R: The code that generated the shapefile from latlon.csv
- From Boston Presentation.pdf: The relevant slides from the Boston presentation
- fa_/ and kx-nz-fisheries-general-
statistical-areas-SHP/: FAO and New Zealand fishing area shapefiles
I just generated the shapes/ram shapefile, and I haven’t figured out how to label each of the shapes its RAM region yet, so you just have to look in latlon.csv for the association.
A working paper of the project this was for is posted here:Â http://ssrn.com/abstract=
The discussion of the geocoding of the RAM database is in the first appendix (which is just tacked on to the end of the paper).
You are welcome to use this data, but please cite that paper.


0 responses so far ↓
There are no comments yet...Kick things off by filling out the form below.