
Everyone’s heard of the logistic map:
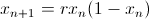
It’s elegant, it’s powerful (a classic for modeling ecosystems, e.g.), and it’s incredibly chaotic. As you change r, its internal frequency doubles, and then redoubles over a shorter span, and then again and again, until it reaches an infinity frequency over a finite distance. So you get beautiful fractal pictures like the following, bursting with internal structure:
But they rarely tell you how you get the picture, or what it means. The closest you get is that these are “asymptotic” values– a meaningless statement for something that never settles down.
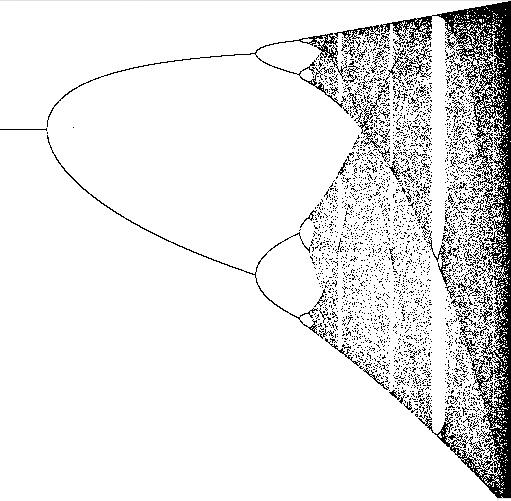
So, I made an animation. In it, I just keep adding new points, each with a value of r and an initial value of x, and let them fly.
0 responses so far ↓
There are no comments yet...Kick things off by filling out the form below.