How big are the economic risks of climate change for a single country? And how do we account for all the different ways climate change can hurt people and economies—not just obvious impacts like flooding and heat, but also global spillovers and hard-to-quantify “missing” risks?
These questions have driven a lot of my recent work. Existing national and global estimates often focus on a handful of impact channels. That leaves us with large gaps and a lot of uncertainty—precisely where policymakers most need clarity.
Our new paper in Nature Climate Change, “Comprehensive national climate damage assessments framework applied to the UK”, tries to tackle this problem head-on.
We develop an emulation-based framework for national climate damage assessment and apply it to the UK, which is a good test case because there is unusually rich evidence: detailed impact models, multi-model studies, and expert elicitations from the UK Climate Change Risk Assessment.
What we did:
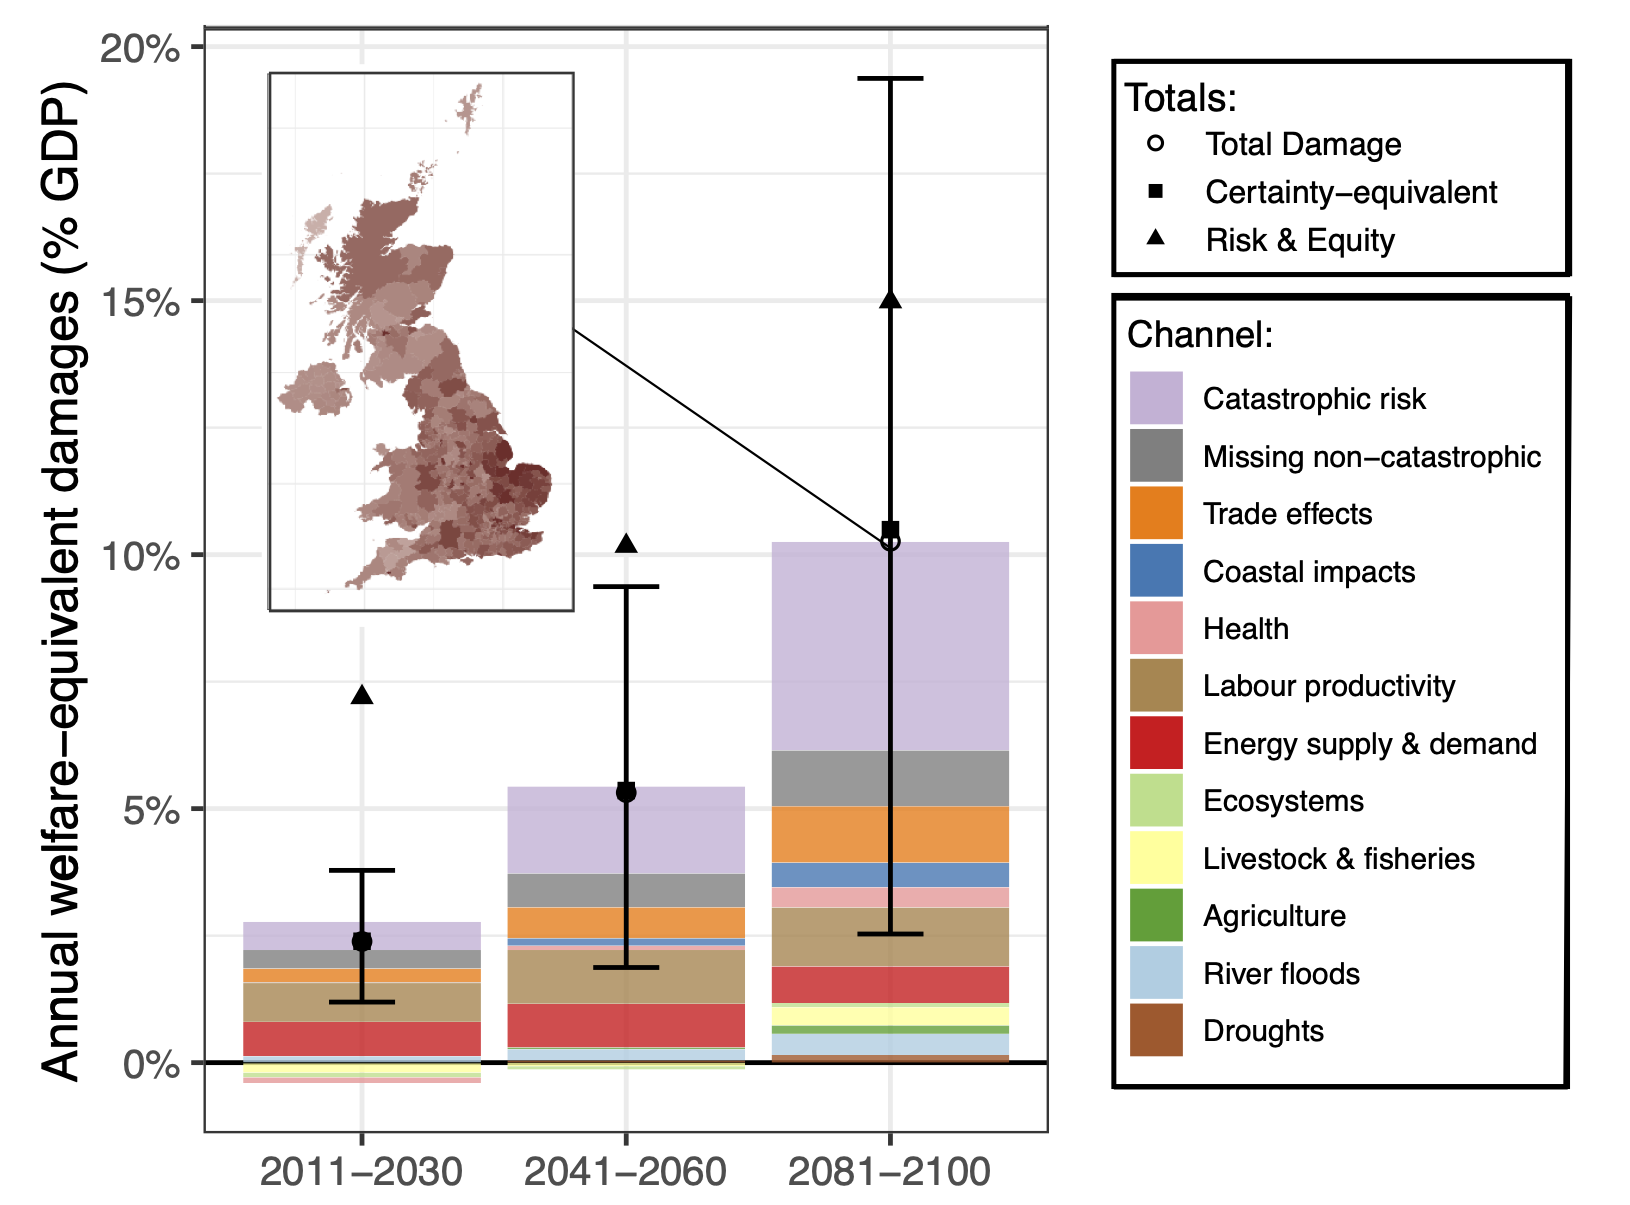
- Integrated 27 impact models plus expert assessments across 13+ impact channels (agriculture, labour productivity, energy, health, floods, coastal impacts, ecosystems, fisheries, etc.).
- Added two key missing pieces that are usually left out:
- Trade spillovers from climate impacts in other countries transmitted through global supply chains.
- “Missing risks”, calibrated from the UK Climate Change Risk Assessment’s expert-based ranges for dozens of under-modelled social, environmental, and infrastructure risks.
- Captured uncertainty comprehensively, propagating climate and socioeconomic uncertainty through a common set of scenarios.
- Disaggregated the results to 406 local areas (ADM3 regions) across the UK, so we can see how risks vary across places rather than just at the national average.
- Aggregated everything into welfare-equivalent damages, allowing us to compare market and non-market impacts on a consistent footing and to account for risk aversion and equity.
What we found:
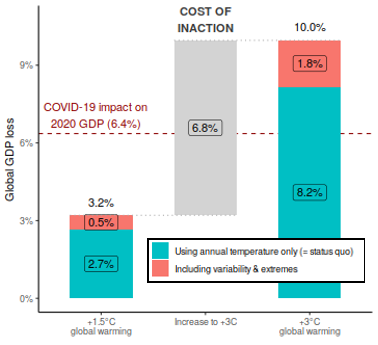
- Current warming already implies welfare-equivalent losses of about 2% of UK GDP (95% CI 1–4%).
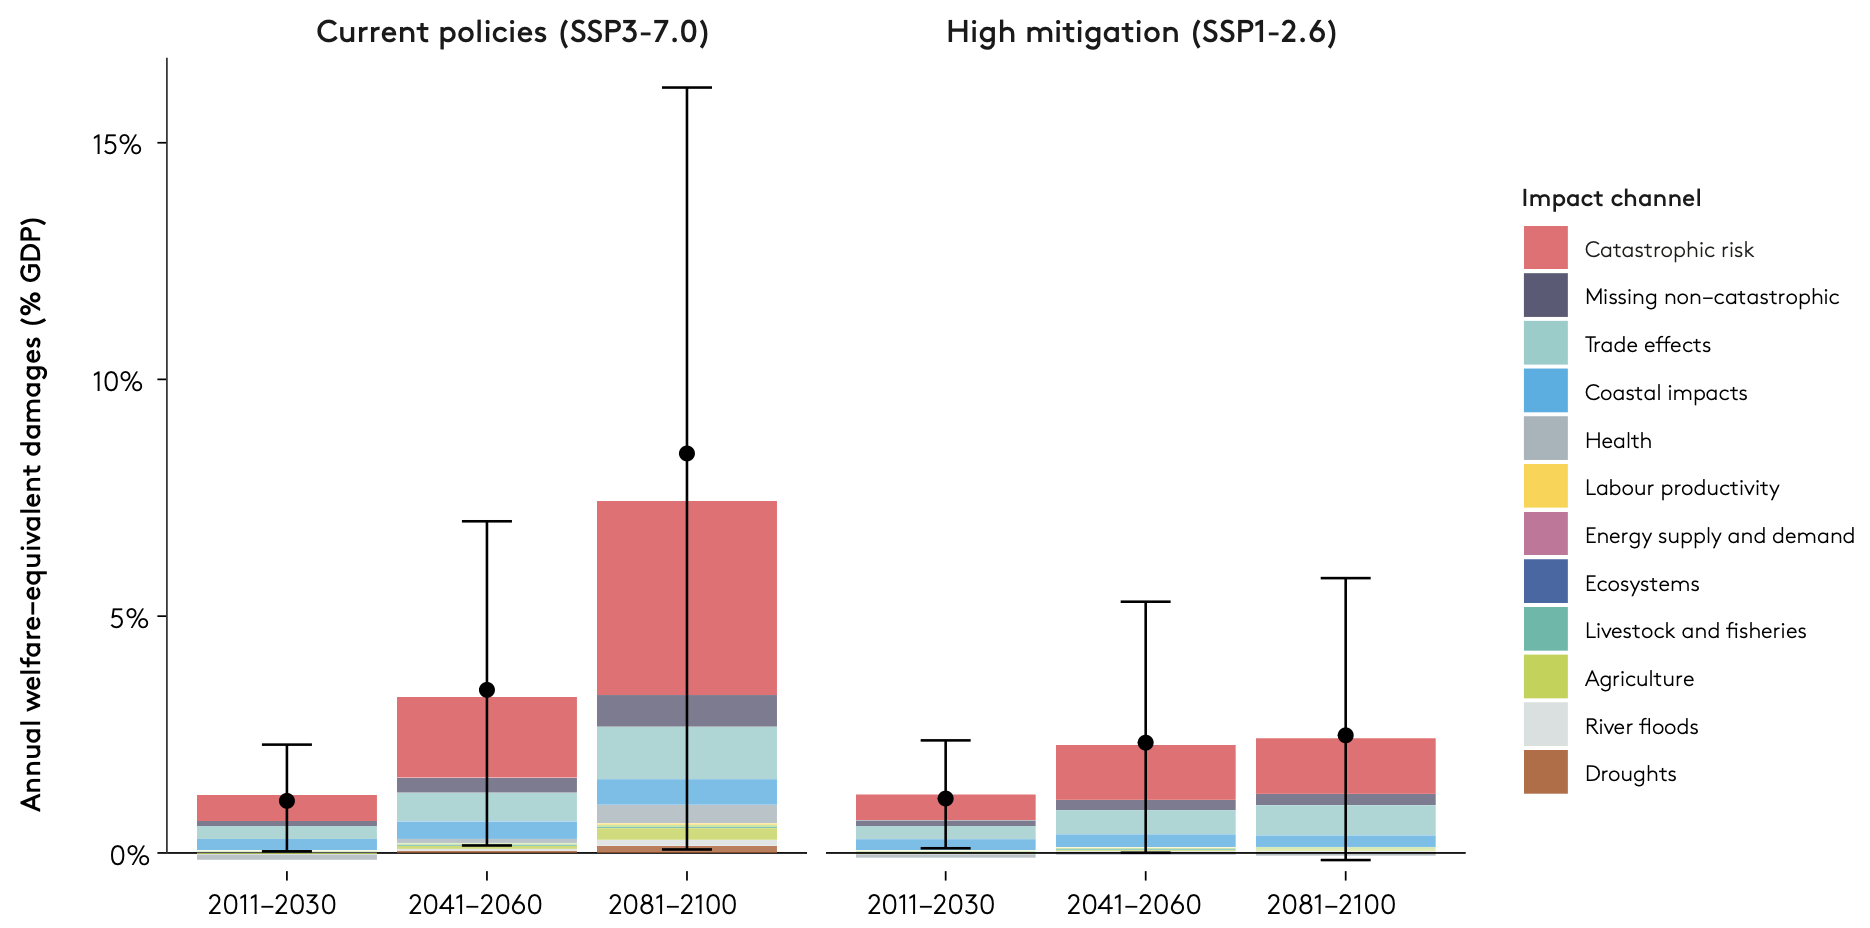
- Under a high-emissions baseline (SSP3-7.0), damages grow rapidly to around 10% of GDP (2–20%) by the end of the century.
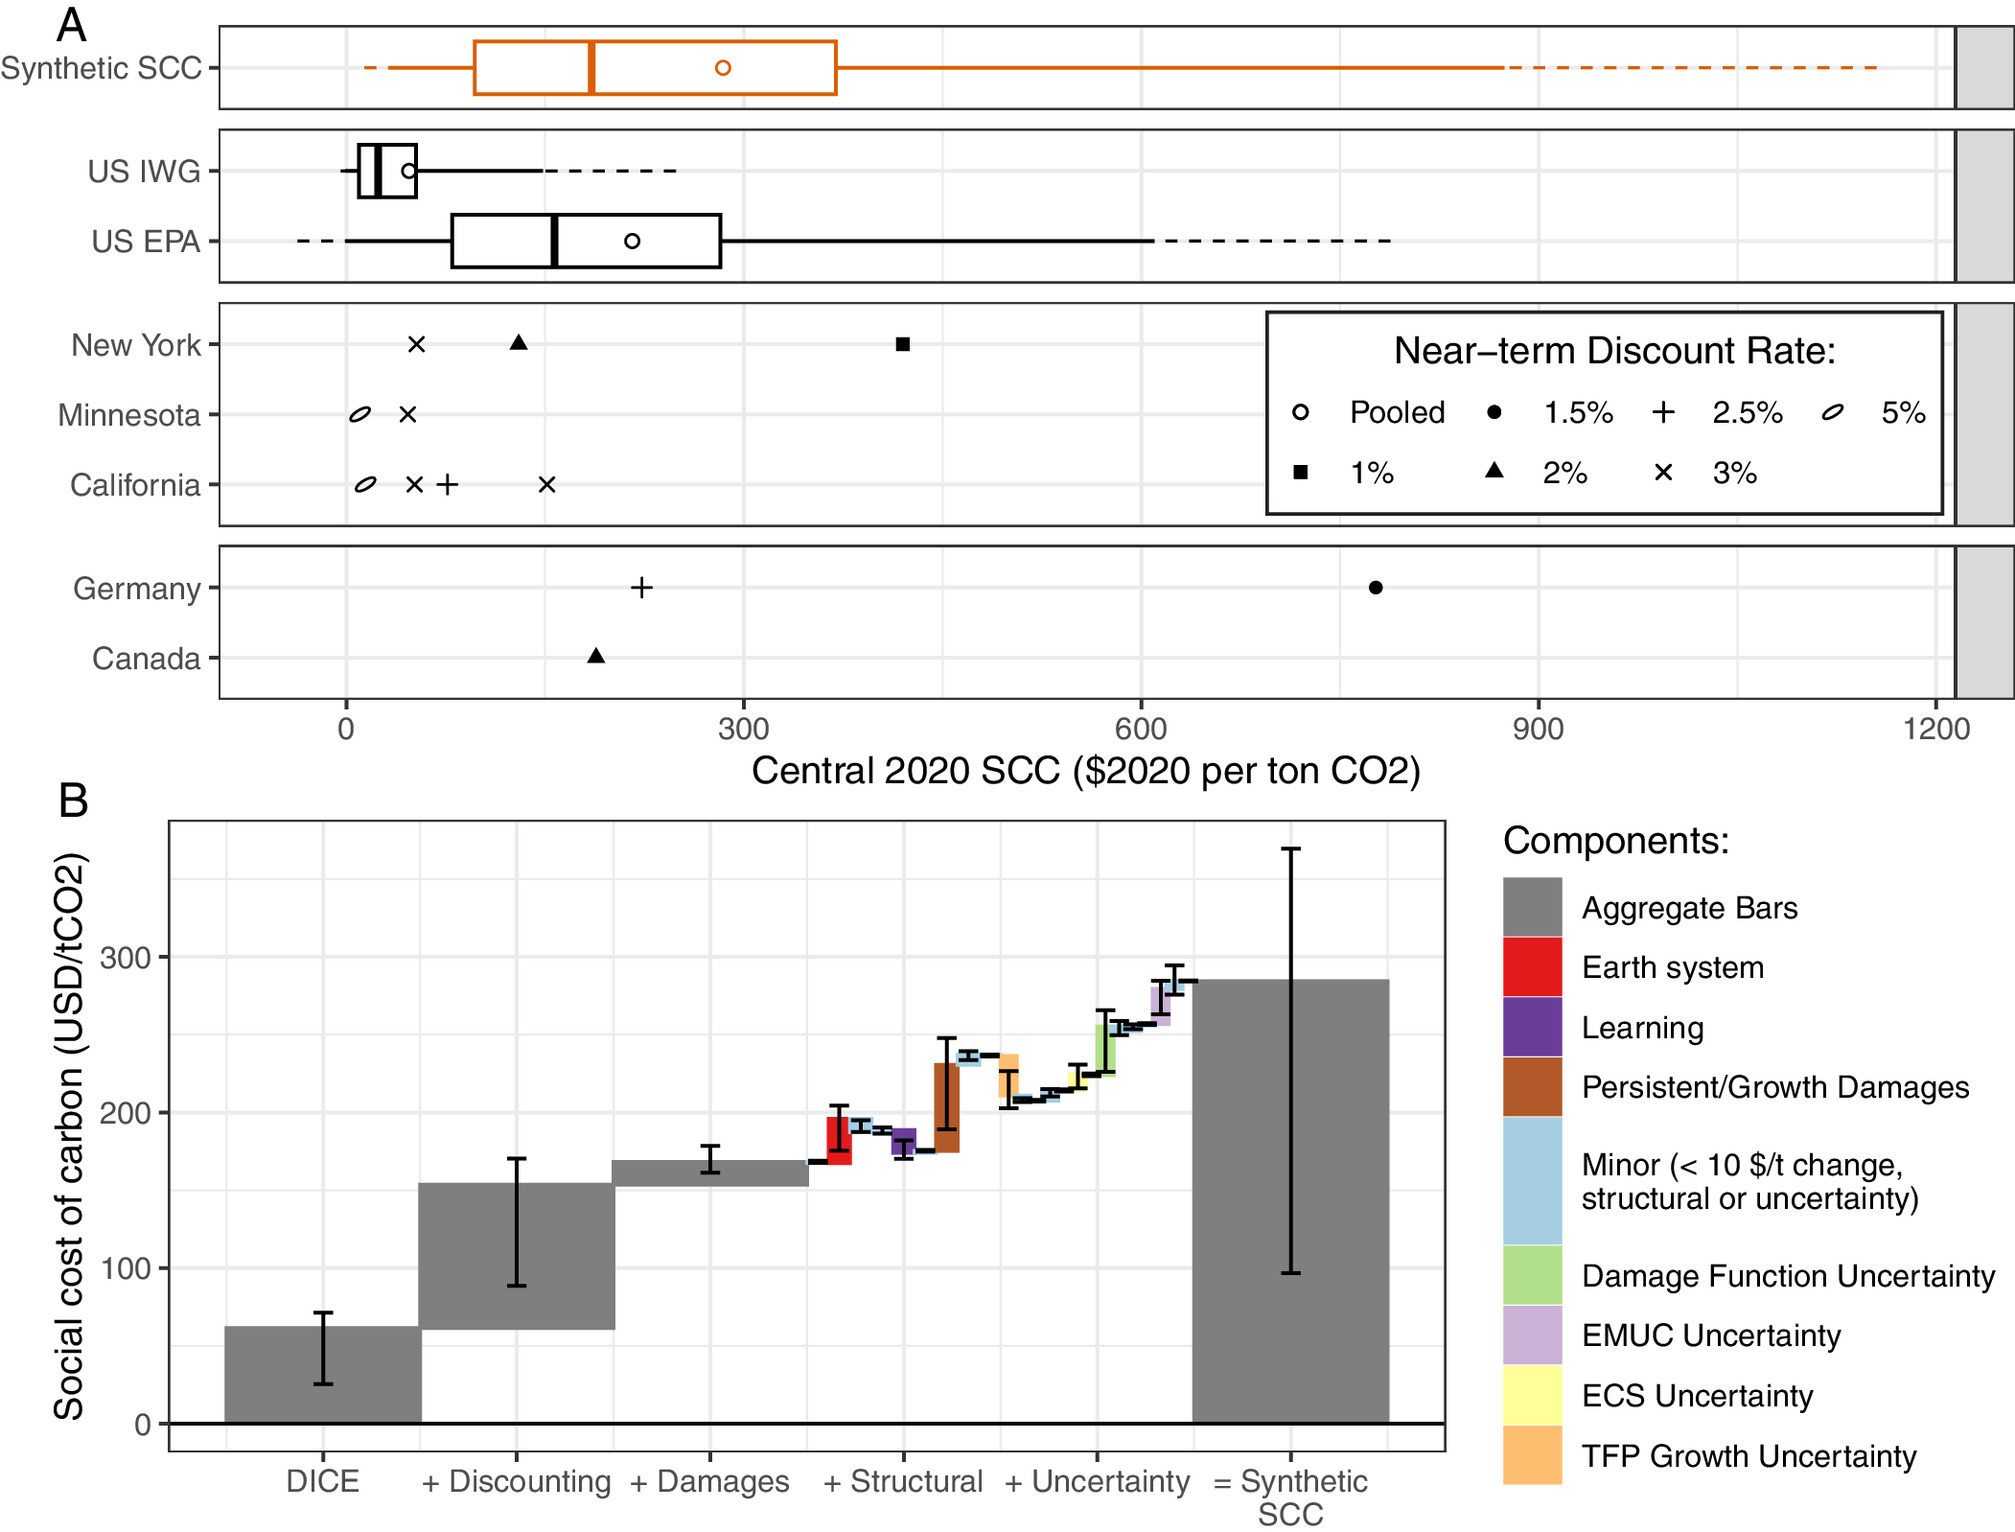
- Roughly half of expected total damages—and most of the uncertainty—come from catastrophic and missing risks. These components are largely absent from many existing policy-relevant estimates, including recent social cost of carbon calculations.
- Damages are highly uneven across regions: every local area sees expected losses above 5% of local GDP by the end of the century under the baseline, but the mix of dominant risks (coastal flooding, agriculture, heat, energy demand, etc.) varies markedly.
- Strong global mitigation (SSP1-2.6) greatly reduces these damages, bringing end-century impacts down to levels similar to mid-century under the baseline, and lowering national welfare-equivalent losses from about 11–16% of GDP (with risk and equity weighting) to around 7%.
The broader goal of this work is methodological: to show how we can move from fragmented, sector-by-sector impact studies to something closer to comprehensive, consistent national climate damage accounts, and to do so in a way that:
- Uses the best available sectoral science,
- Makes uncertainty explicit rather than hiding it,
- And foregrounds the role of risks we still understand poorly.
We hope this framework can be extended to other countries and regions as the underlying impact literature grows.
Here is one of the key figures from the paper, summarizing total damages across channels and over time:
You can read the paper here:
https://doi.org/10.1038/s41558-026-02665-2
Data and replication code are openly available:
Data: https://doi.org/10.5281/zenodo.14942090
Code: https://doi.org/10.5281/zenodo.19673544