The effects of climate change on migration are a… moving concern. The news usually go under the heading of climate refugees, like the devastated hoards emanating from Syria. But there is already a less conspicuous and more persistent flow of climate migrants: those driven by a million proximate causes related to temperature rise. These migrants are likely to ultimately represent a larger share of human loss, and produce a larger economic impact, than those with a clear crisis to flee.
In most parts of the world, we only have coarse information about where migrants move. The US census might not be representative of the rest of the world, but it’s a pool of light where we can look for our key. I matched up the ACS County-to-County Migration Data with my favorite set of county characteristics, the Area Health Resource Files from the US Department of Health and Human Services. I did not look at migration driven by temperature, because I wanted to know if some of the patterns we were seeing there were a reflection of anything more than the null hypothesis. Here’s what I found.
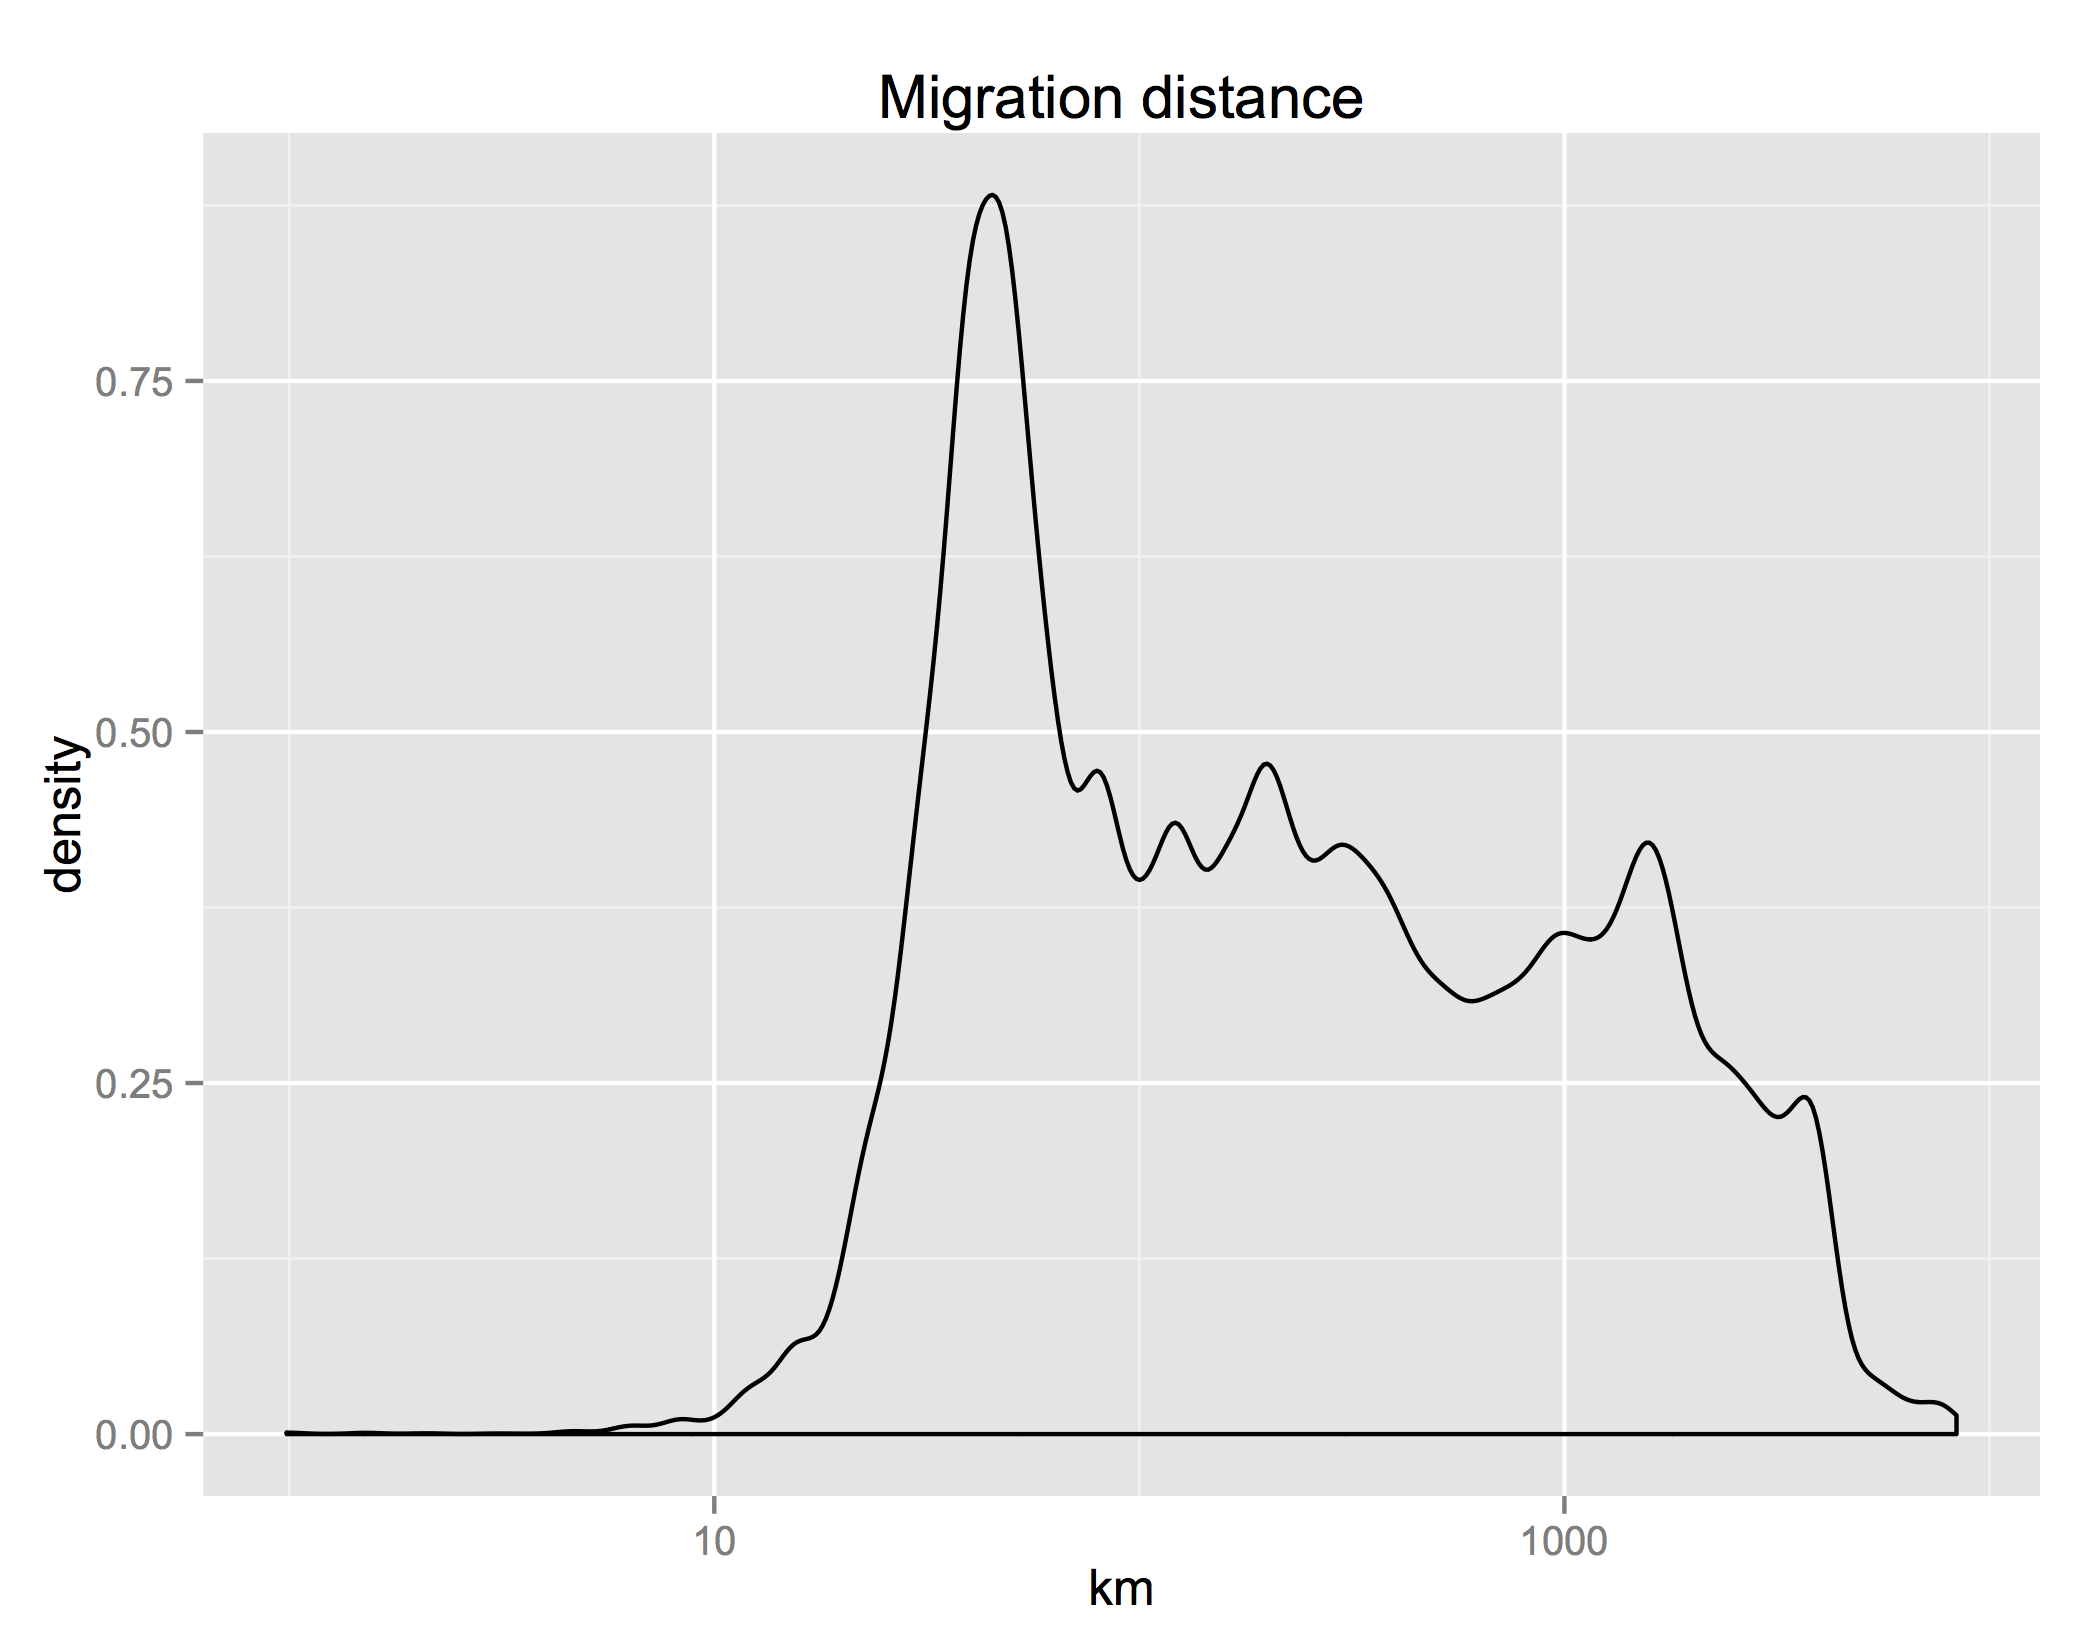
First, the distribution of the distance that people move is highly skewed. The median distance is about 500 km; the mean is almost 1000. Around 10% of movers don’t move more than 100 km; another 10% move more than 2500 km.
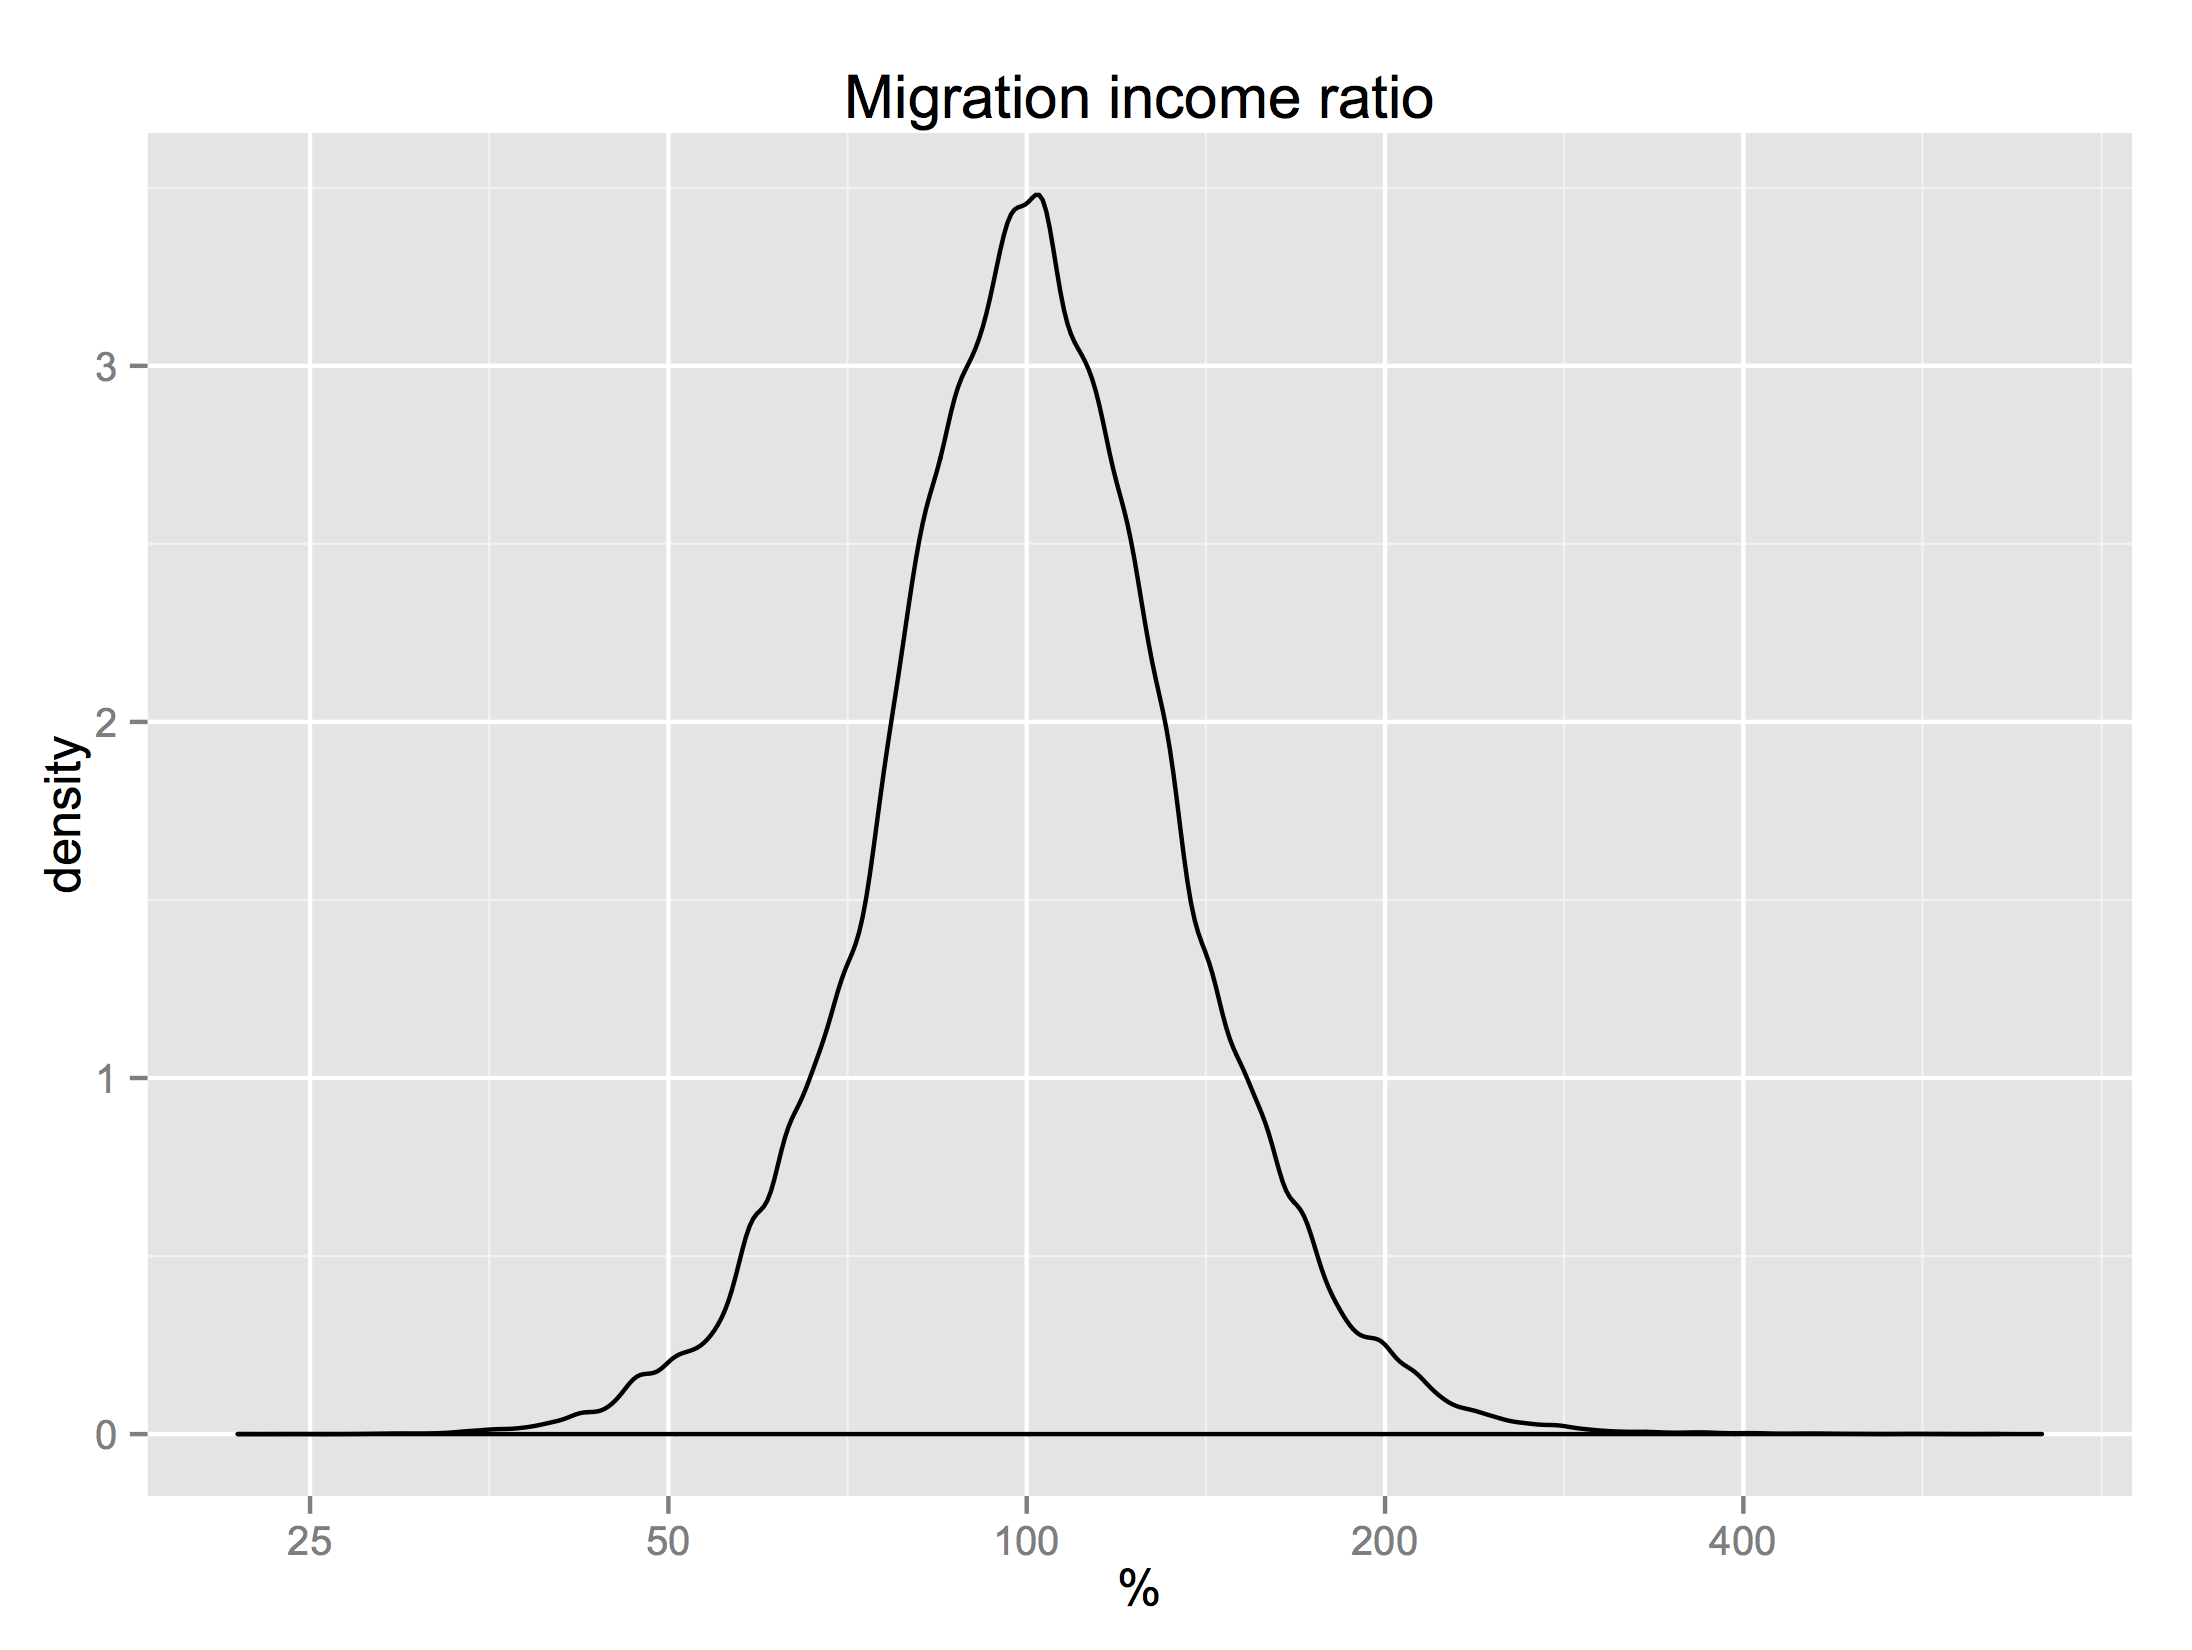
The differences between characteristics of the places where migrants are moving from and where they are moving to reveals an interesting fact: the US has approximate conservation of housing. The distribution of the ratio of incomes in the destination and origin counties is almost symmetric. For everyone who moves to a richer county, someone is abandoning that county for a poorer one. The same for the difference between the share of urban population in the destination and origin counties. These distributions are not perfectly symmetric though. On median, people move to counties 2.2% richer and 1.7% more urban.
 |
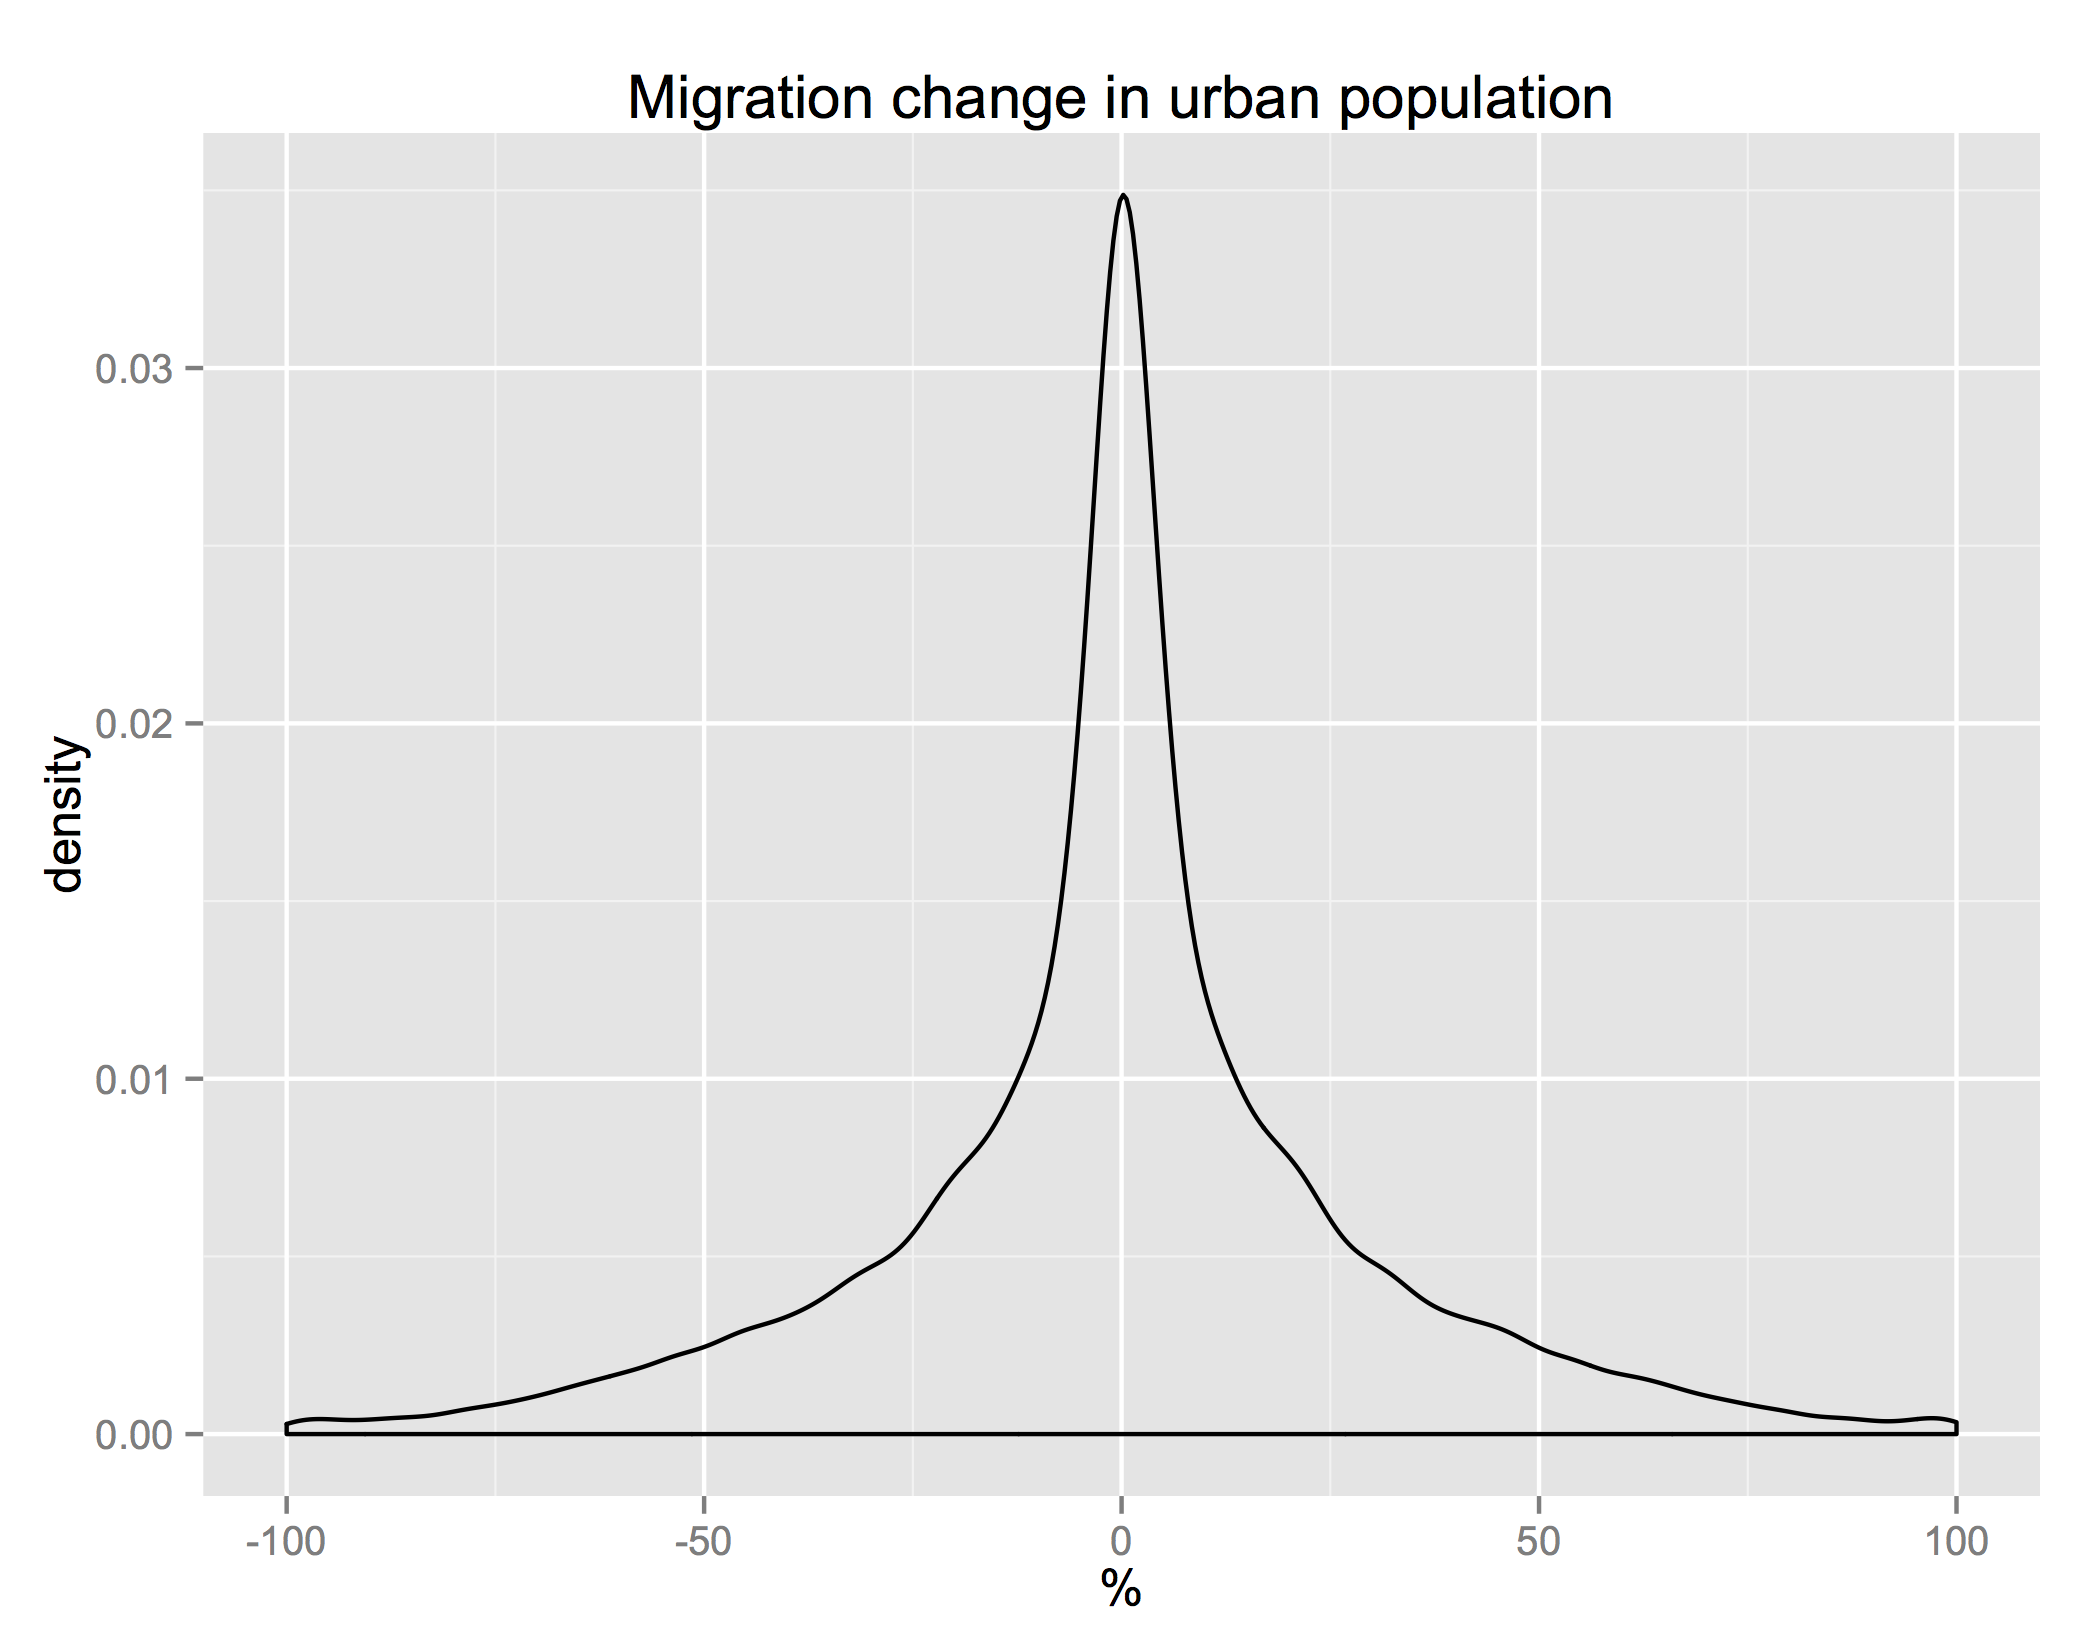 |
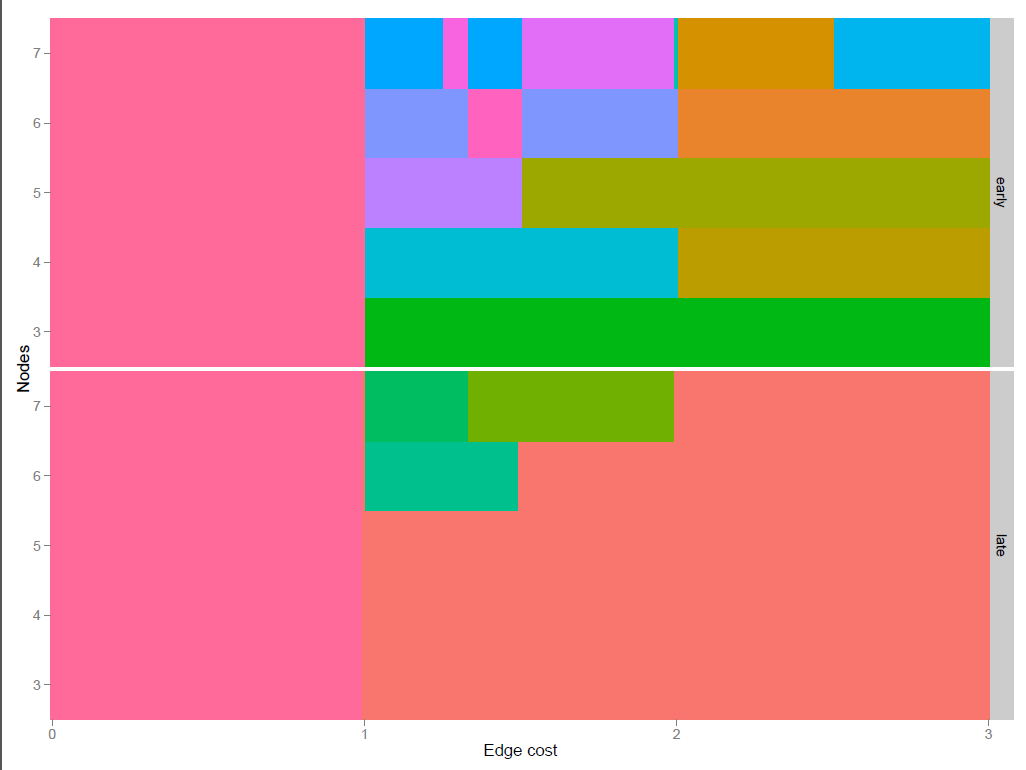
The urban share distribution tells us that most people move to a county that has about the same mix of rurality and urbanity as the one they came from. How does that stylized fact change depending on the backwardness of their origins?

The flows in terms of people show the same symmetry as distribution. Note that the colors here are on a log scale, so the blue representing people moving from very rural areas to other very rural areas (lower left) is 0.4% of the light blue representing those moving from cities to cities. More patterns emerge when we condition on the flows coming out of each origin.
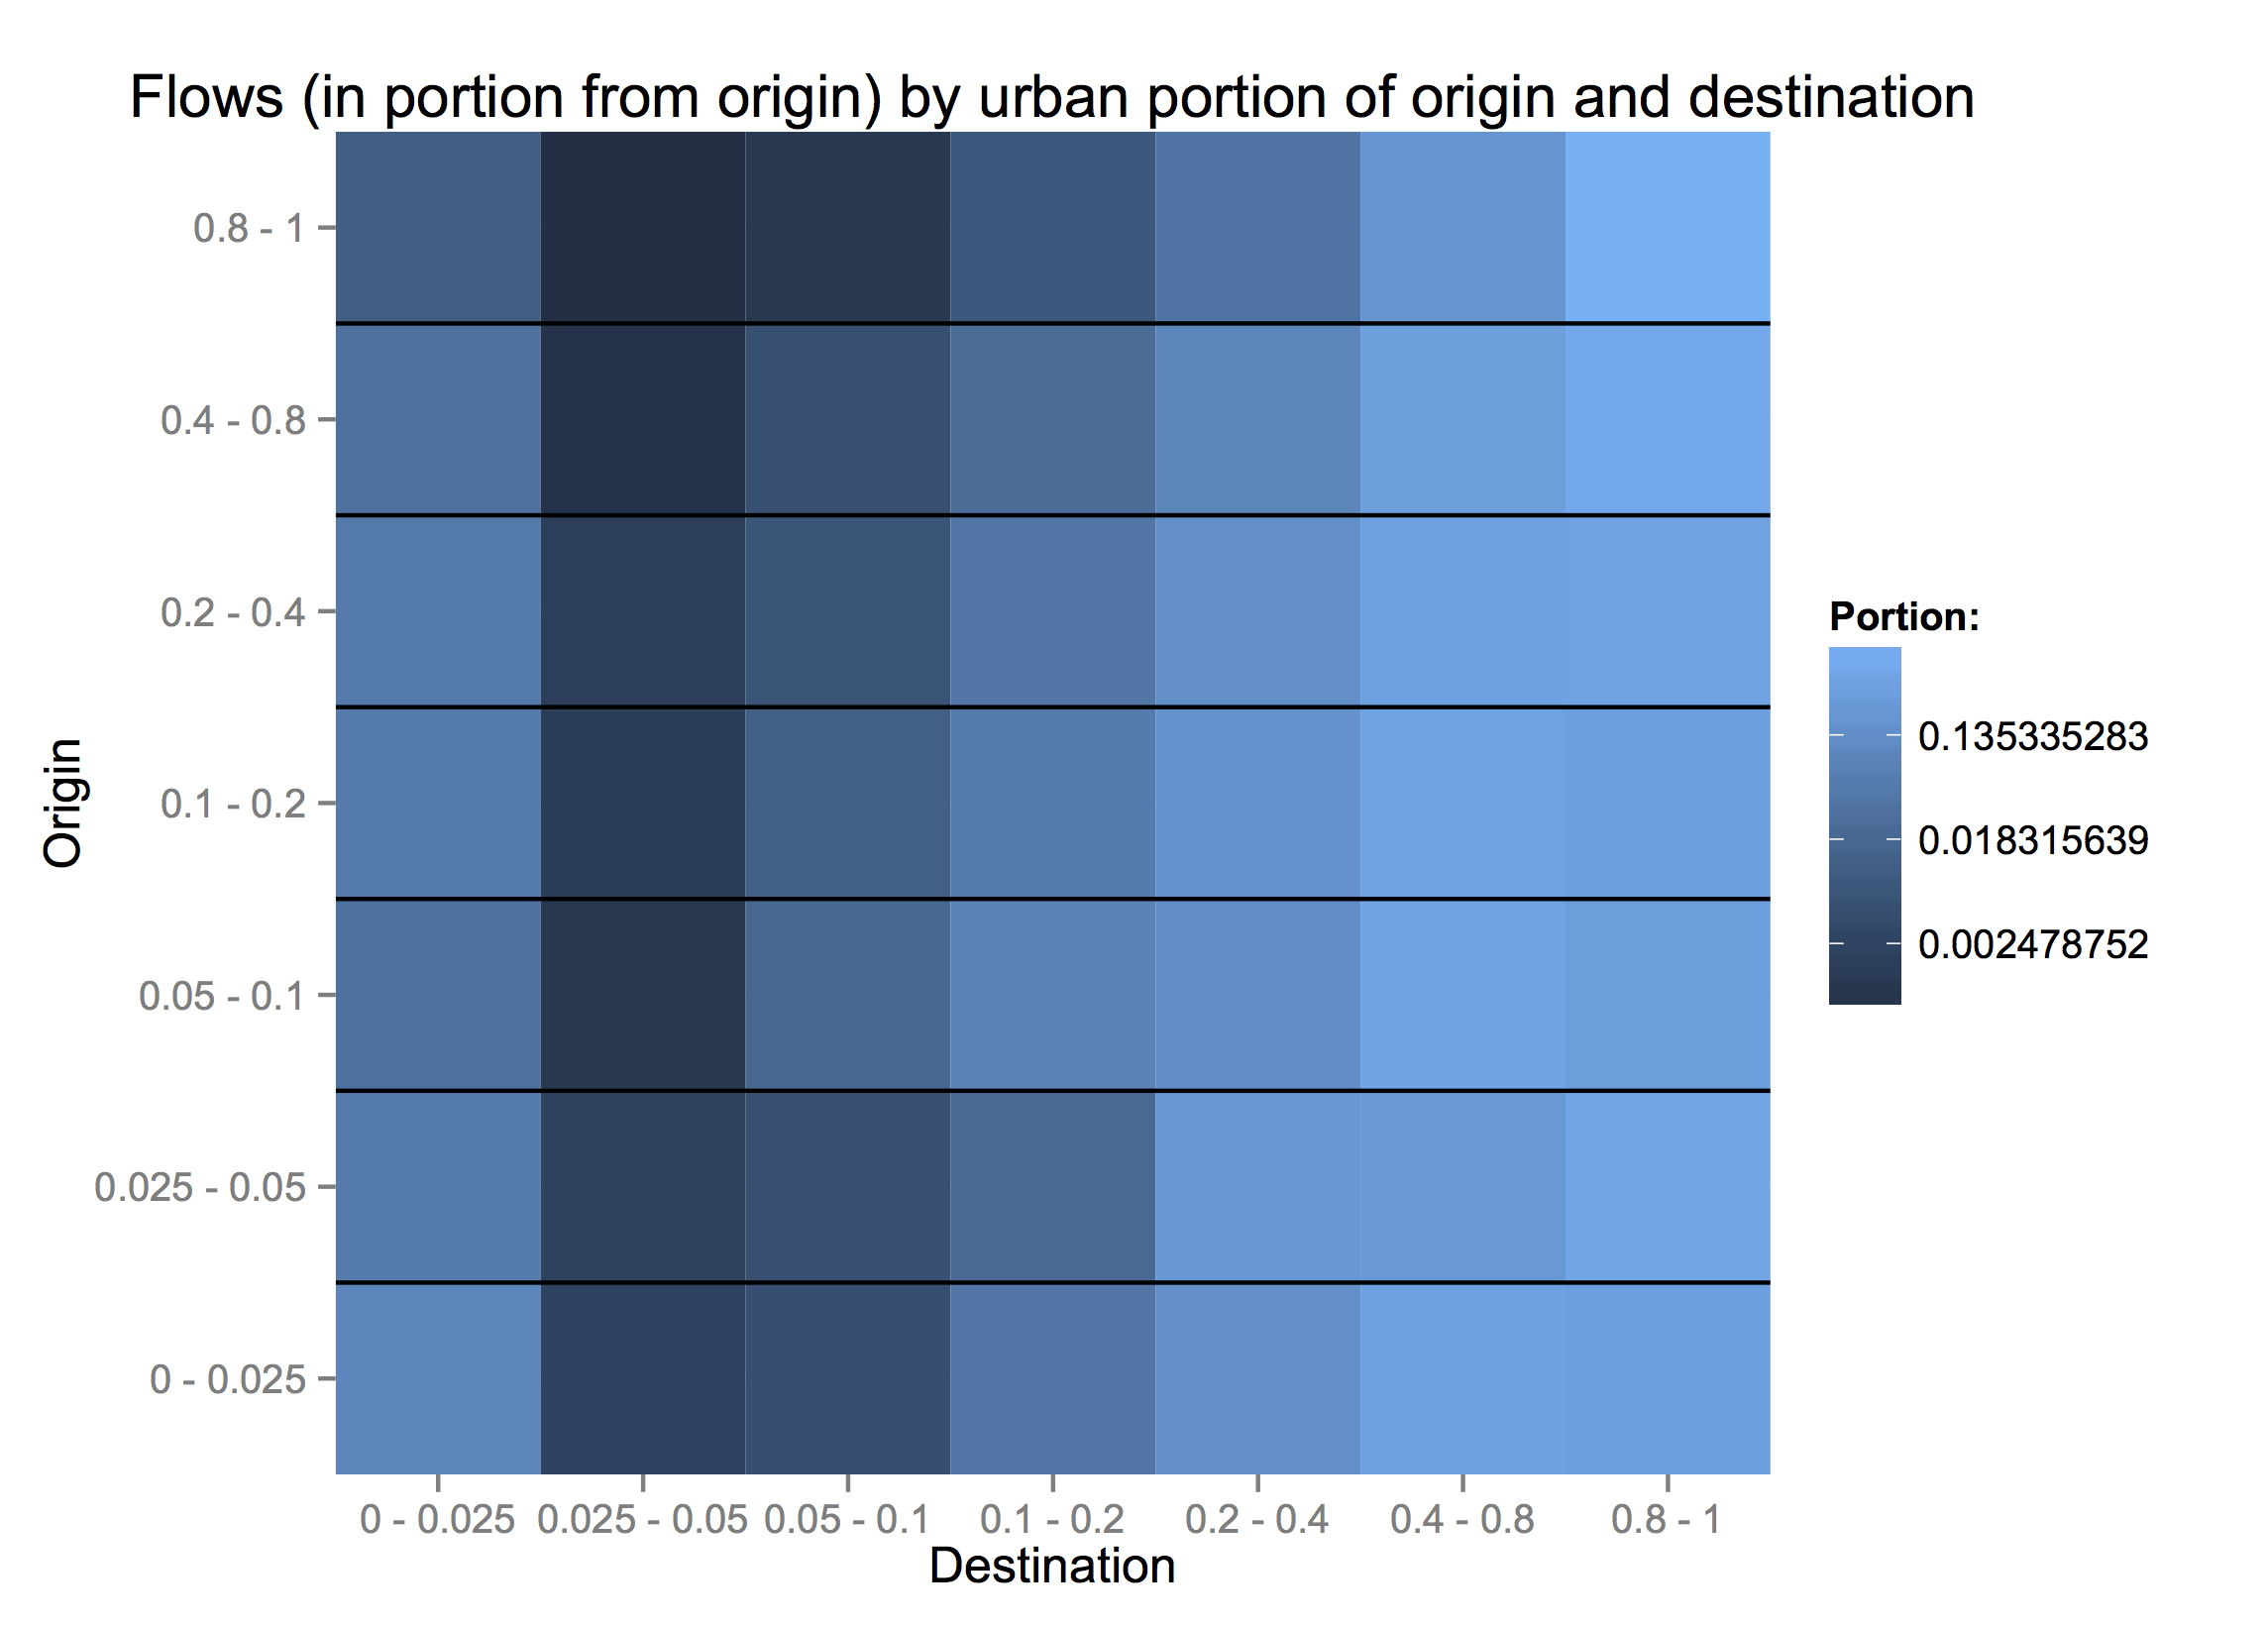
City dwellers are least willing to move to less-urban areas. However, people from completely rural counties (< 5% urban) are more likely to move to fully urban areas than those from 10 - 40% urban counties.
How far are these people moving? Could the pattern of migrants' urbanization be a reflection of moving to nearby counties, which have fairly similar characteristics?
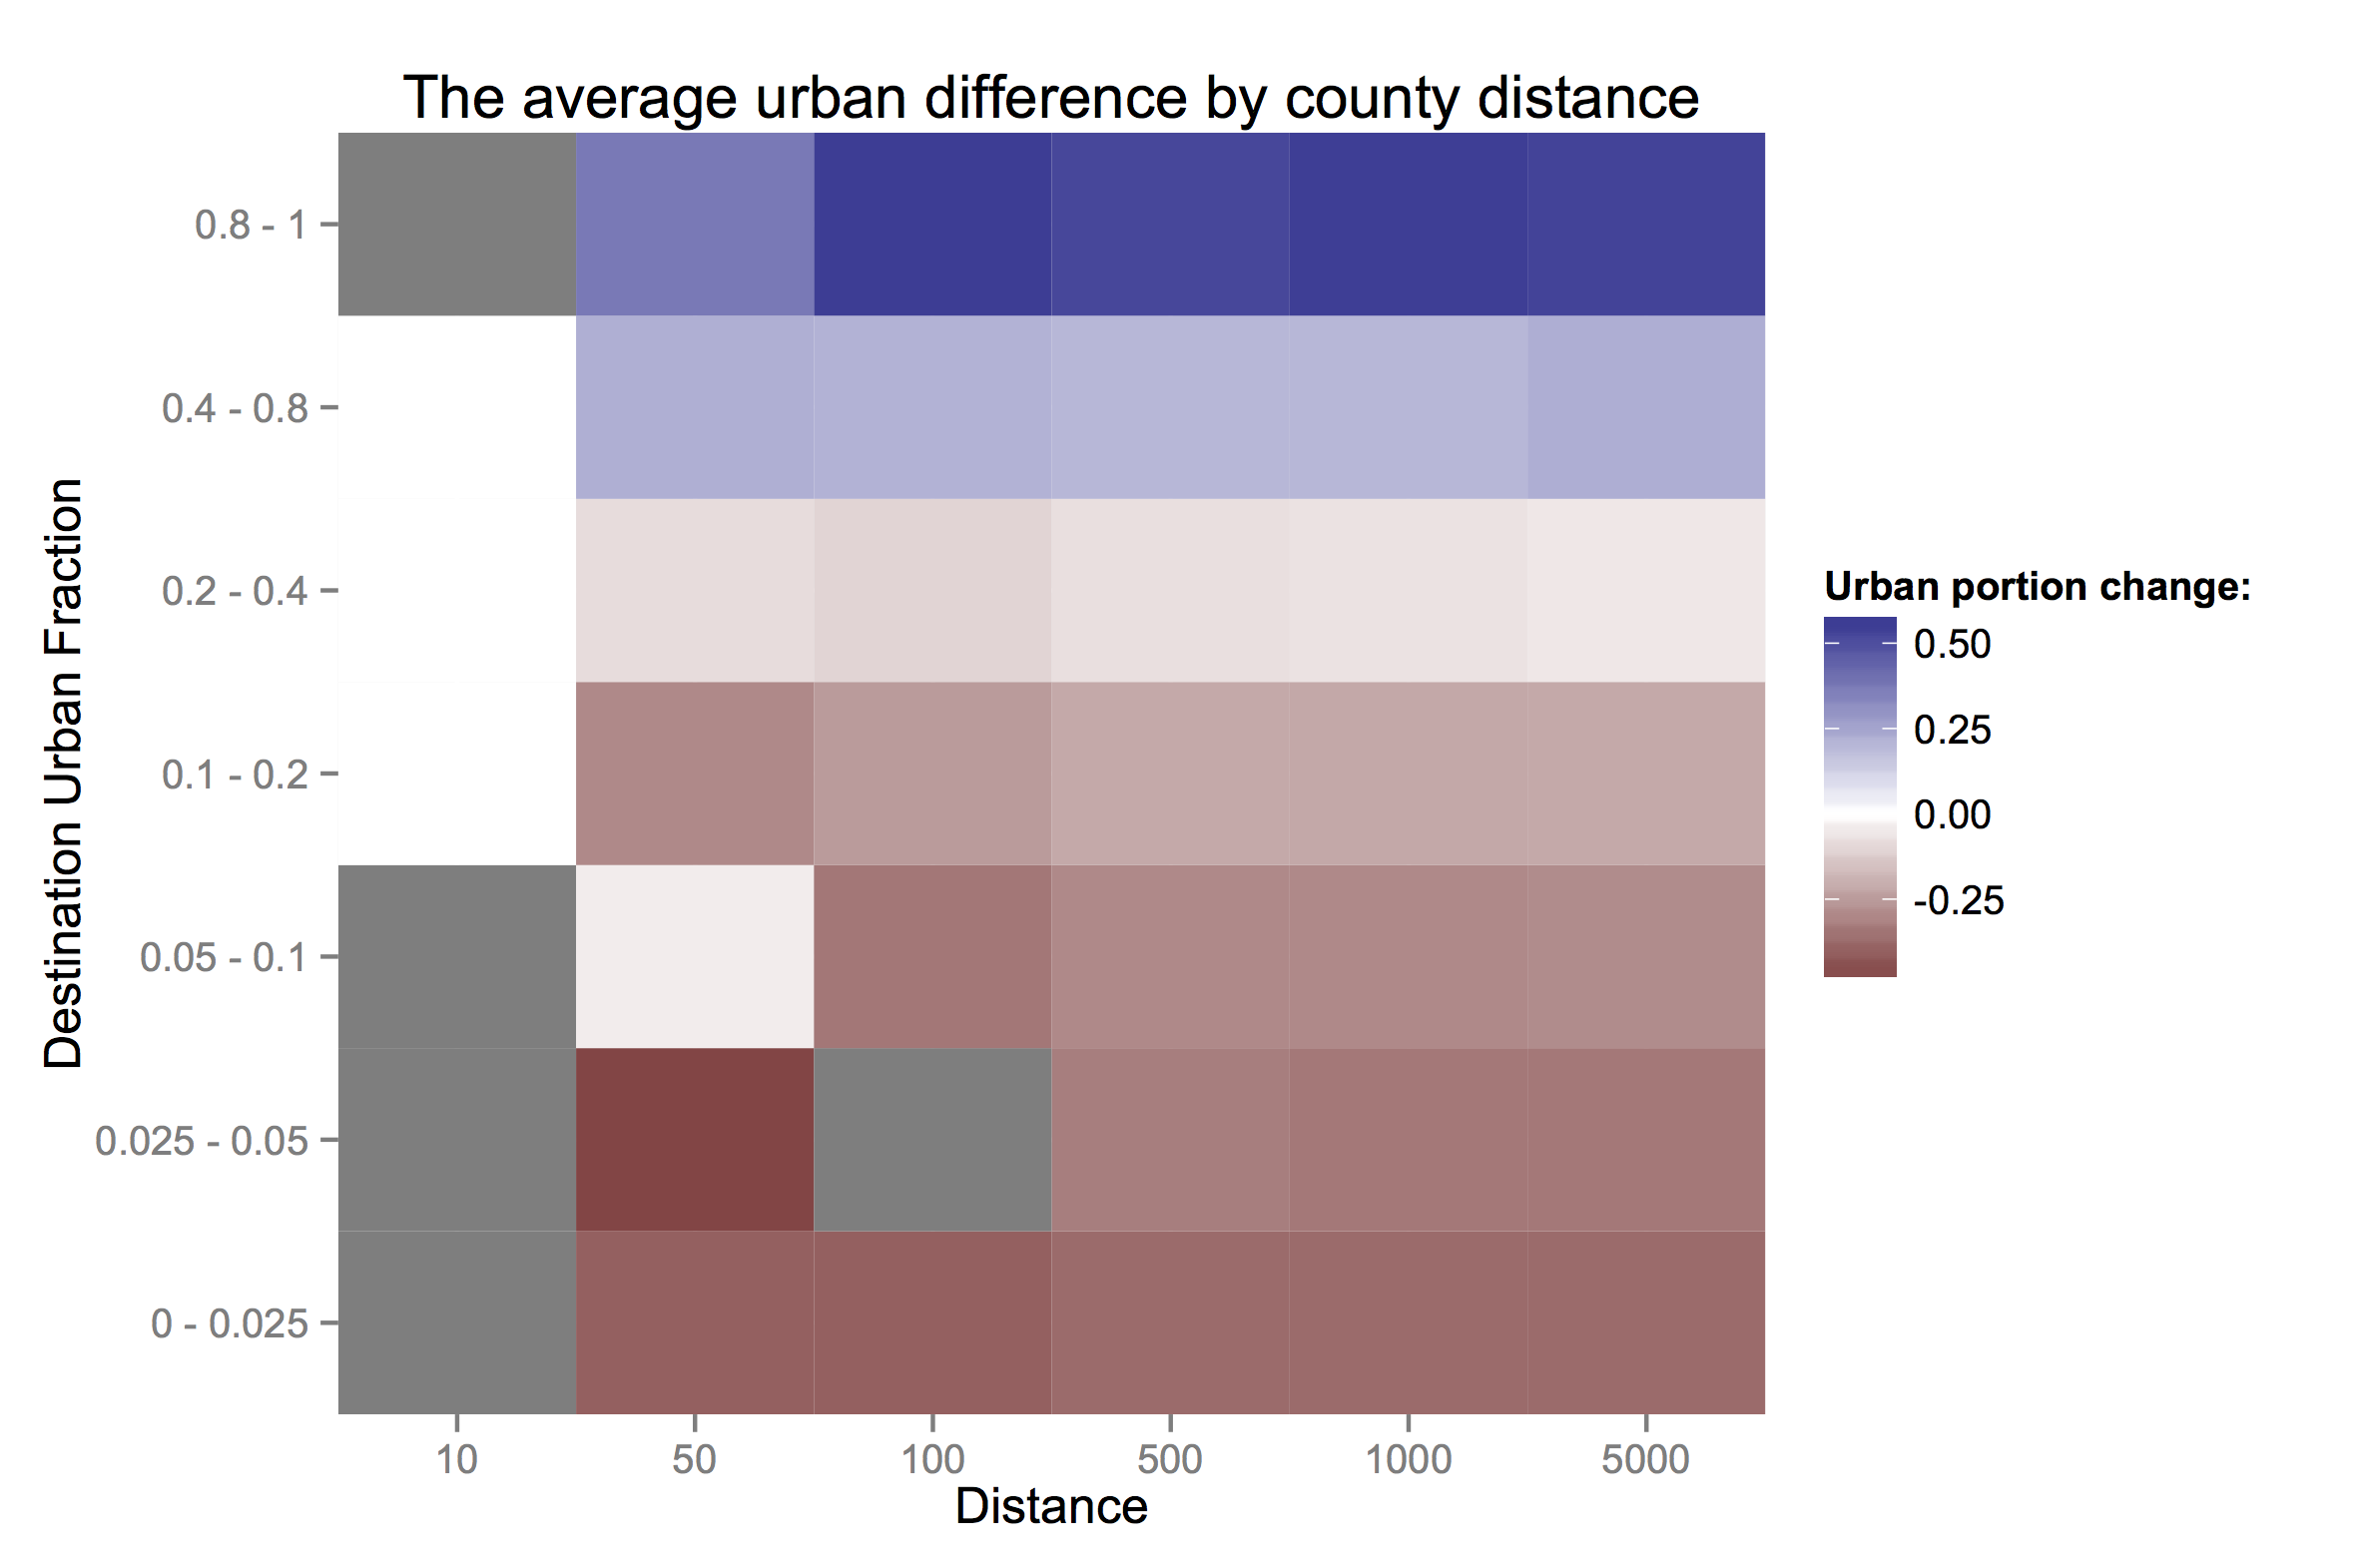
Just considering the pattern of counties (not their migrants) across different kinds degrees of urbanization, how similar are counties by distance? From the top row, on average, counties within 50 km of very urban counties are only slightly less urban, while those further out are much less urban. Counties near those with 20-40% urban populations are similar to their neighbors and to the national average. More rural areas tend to also be more rural than their neighbors.
What is surprising is that these facts are almost invariant across the distance considered. If anything, rural areas are *more* rural than their immediate neighbors than to counties further away.
So, at least in the US, even if people are inching their way spatially, they can quickly find themselves in the middle of a city. People don’t change the cultural characteristics of their surroundings (in terms of urbanization and income) much, but those it is again the suburbs that are stagnant, with rural people exchanging with big cities almost one-for-one.