James A. Rising

Resolving a Hurricane of Questions

August 28, 2014 · Leave a Comment

Maybe questions of social science never get truly resolved. The first year of my PhD, I remember John Mutter describing the question of creative destruction. Sometimes, the story goes, a disaster can lead to an unexpected silver lining. By destroying outdated infrastructure, or motiving people to work together, or driving a needed influx of aid, a disaster can eventually leave a community better off than beforehand. Mutter described it almost like a philosophical quandary. In the face of all the specifics of institutions, internal perceptions, and international relations, how will we ever know?

For years now, Solomon Hsiang has been producing insights from his LICRICE model, turning hurricanes into exogenous predictors. As these random shocks echo through societies, he’s been picking up everything that falls out. I got to listen to some of it when news reporters would call his office. His work with Jesse Anttila-Hughes turned up the true mortality threat of disasters, typically 10x the lives lost at the time of the event. Jesse dug further, finding how family assets changed, how meals were redistributed, and how young girls are often the most hurt, even those born after the disaster.

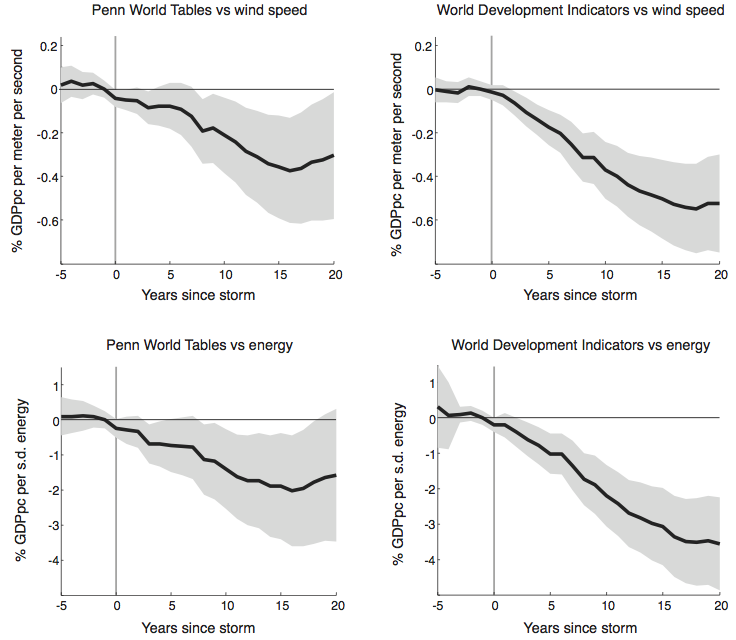
Last month, Sol and Amir Jina produced an NBER working paper that steps back from the individual lives affected. Their result is that a single storm produces losses that continue to accumulate for 20 years. People are not only continuing to feel the effects of a hurricane 20 years down the road, but they additional poverty they feel at 10 years is only half of the poverty that they’ll feel in another 10.

hurricanes

Of course, this is an average effect, and an average of 6415 different country results. But that means that for every country that experiences no long-term effect, one experiences twice the poverty.

So, is there creative destruction? It’s very, very unlikely. The most likely situation is “no recovery”: countries will never return to the trend that they were on prior to the event. Things are even more dire under climate change,

For a sense of scale, our estimates suggest that under the “Business as usual” scenario (with a 5% discount rate) the [present discounted value] of lost long-run growth is $855 billion for the United States (5.9% of current GDP), $299 billion for the Philippines (83.3% of current GDP), $1 trillion for South Korea (73% of current GDP), $1.4 trillion for China (12.6% of current GDP), and $4.5 trillion for Japan (101.5% of current GDP).

That’s what we should be willing to pay to avoid these costs. In comparison to the $9.7 trillion that just additional hurricanes are expected to cost, the $2 trillion that Nordhaus (2008) estimates for the cost of a climate policy seems trivial. That’s two big, seemingly unanswerable questions as settled as things get in social science.

→ Leave a CommentCategories: Essays

Classes Diagram

August 26, 2014 · Leave a Comment

Sometimes a diagram helps me find order in chaos, and sometimes it’s just a way to stroke my ego. I was recently trying to make sense of my graduate school classes, even as they’re becoming a less and less important share of my gradschool learning. So, I added to a diagram I’d made ten years ago for college.  In the end, I’m not sure which purpose it serves more.

classes

The diagram is arrayed by discipline and year. The disciplines are arranged like a color wheel (and classes colored accordingly), from theoretical math, through progressively more applied sciences, through engineering and out the other end into applied humanities (like music), and finally back to theoretical philosophy. Arrows give a sense of thematic and prerequisite relationships.

Economics, a core of the Sustainable Development program, probably sits around the back-side of the spectrum, between philosophy and math. I squeezed it in on the left, more as a reflection of how I’ve approached it than what it tried to teach.

This is also missing everything I’ve learned from classes I’ve taught. I wish there were a place for Progressive Alternatives from two years ago, or Complexity Science from last year. I guess I need another diagram.

→ Leave a CommentCategories: Activities

Python SoundTouch Wrapper

August 3, 2014 · Leave a Comment

SoundTouch is a very useful set of audio manipulation tools, with three powerful features:

  • Adjusting the pitch of a segment, without changing its tempo
  • Adjusting the tempo of a segment, without changing its pitch
  • Detecting the tempo of a segment, using beat detection

I used SoundTouch when I was developing CantoVario under the direction of Diana Dabby and using her algorithms for generating new music from existing music, using Lorenz attractors.  SoundTouch is a C++ library, but CantoVario was in python, so I built a wrapper for it.

Now you can use it too!  PySoundTouch, a python wrapper for the SoundTouch library is available on github!  It’s easy to use, especially with the super-cool AudioReader abstraction that I made with it.

AudioReader provides a single interface to any audio file (currently MP3, WAV, AIF, and AU files are supported).  Here’s an example of using AudioReader with the SoundTouch library:

# Open the file and convert it to have SoundTouch's required 2-byte samples
reader = AudioReader.open(srcpath)
reader2 = ConvertReader(reader, set_raw_width=2)

# Create the SoundTouch object and set the given shift
st = soundtouch.SoundTouch(reader2.sampling_rate(), reader2.channels())
st.set_pitch_shift(shift)

# Create the .WAV file to write the result to
writer = wave.open(dstpath, 'w')
writer.setnchannels(reader2.channels())
writer.setframerate(reader2.sampling_rate())
writer.setsampwidth(reader2.raw_width())

# Read values and feed them into SoundTouch
while True:
    data = reader2.raw_read()
    if not data:
        break

    print len(data)
    st.put_samples(data)

    while st.ready_count() > 0:
        writer.writeframes(st.get_samples(11025))

# Flush any remaining samples
waiting = st.waiting_count()
ready = st.ready_count()
flushed = ""

# Add silence until another chunk is pushed out
silence = array('h', [0] * 64)
while st.ready_count() == ready:
    st.put_samples(silence)

# Get all of the additional samples
while st.ready_count() > 0:
    flushed += st.get_samples(4000)

st.clear()

if len(flushed) > 2 * reader2.getnchannels() * waiting:
    flushed = flushed[0:(2 * reader2.getnchannels() * waiting)]

writer.writeframes(flushed)

# Clean up
writer.close()
reader2.close()

→ Leave a CommentCategories: Software

Web Scraping in Python

July 2, 2014 · Leave a Comment

I’m running a pair of seminars to introduce people to python, for the purpose of extracting data from various online sources.  I still need to write up the content of the seminars, with plenty of examples at from trivial to intermediate.  But first, I wanted to post the diagram I did for myself, to think about how to organize all of this material: a diagram.

How do the elements of python connect to each other, how do they relate to elements on the web, and how do elements on the web related to each other?

Scraping Python Tutorial

Boxes are python elements and ovals are web elements. I aimed to cover everything in brown, touch on items in blue, and at-most mention items in grey.

→ Leave a CommentCategories: Activities · Software · Teaching

Risky Business Report released today!

June 25, 2014 · Leave a Comment

Sol, Amir, and I have been slaving away over a report on the business-case for fighting climate change.  And it was released this morning!  The media outlets give a sense of the highlights:

Forbes:
Today’s report from Risky Business – the project chaired by Steyer, former U.S. Treasury Secretary Hank Paulson, and former NYC Mayor Michael Bloomberg – puts actual numbers on the financial risk the United States faces from unmitigated climate change.
New York Times:
[Quotes our guy:] “the most detailed modeling ever done on the impact of climate change on specific sectors of the U.S. economy.”

Huffington Post:
Parts Of America Will Be ‘Unsuited For Outdoor Activity’ Thanks To Climate Change, Report Finds

Financial Times:
For example, by the last two decades of the century, if greenhouse gas emissions carry on rising unchecked, the net number of heat and cold-related deaths in the US is forecast as likely to be 0.9 per cent to 18.8 per cent higher. But the analysis also shows a one in 20 chance that the number of deaths will rise more than 32.56 per cent, and another one in 20 chance that it will fall by more than 7.77 per cent.
Twitter:

#RiskyBusiness: By end of the century, OR, WA & ID could have more days > 95°F/yr than there are currently in Texas | http://riskybusiness.org/uploads/files/RiskyBusiness_PrintedReport_FINAL_WEB_OPTIMIZED.pdf …

2050: $66b-$106b of US coastal property likely under water, $238b-$507b worth by 2100 #ClimateChange #riskybusiness http://bit.ly/1sANaJj

Also Huff Po:
Higher temperatures will reduce Midwest crop yields by 19 percent by midcentury and by 63 percent by the end of the century.

The region, which has averaged eight days of temperatures over 95 degrees each year, will likely see an additional 17 to 52 of these days by midcentury and up to four months of them by the end of the century. This could lead to 11,000 to 36,000 additional deaths per year.

There’s also some over-the-top praise from the choir– Amir can send you some gems from
Capitalists Take on Climate Change.

Take a look!  Here’s the media report:
http://riskybusiness.org/report/overview/executive-summary

And the scientific report (what we actually helped write):
http://rhg.com/reports/climate-prospectus

→ Leave a CommentCategories: Research

R Packages for Bayesian Networks

June 22, 2014 · Leave a Comment

I’m in a group studying Bayesian techniques for environmental research, under Upmanu Lall at the Earth Institute. We recently did a session on the packages available in R for modeling Bayesian Networks. Here’s the spreadsheet that came out of the meeting:

→ Leave a CommentCategories: Research

Risky Business: The Economic Risks of Climate Change in the United States

June 20, 2014 · Leave a Comment

Next Thursday I’ll be in DC for one of the briefings on a big report I’ve been helping write. The event is at Resources for the Future– feel free to join in.

A Discussion of the Independent Risk Assessment for Risky Business: The Economic Risks of Climate Change in the United States

How much economic risk does the nation face from the impacts of climate change? The Risky Business initiative—a project of Bloomberg Philanthropies, the Office of Hank Paulson, and Next Generation—works to answer that question. Using the best information available, the initiative outlines the range of climate futures that the United States might expect in major economic sectors and by geographic region. It also examines the likelihood of these futures and the potential economic consequences for American businesses and households. The initiative does not advocate any particular policy, industry, or personal response to climate change but instead seeks to provide government, finance, business, and household decisionmakers with the information necessary to make their own risk management decisions.

At this RFF seminar, Trevor Houser, lead author of the independent risk assessment supporting the Risky Business initiative, and his colleagues will present an overview of the methods, data, original research, and key findings in the assessment. A panel of experts will then offer additional perspectives.

→ Leave a CommentCategories: Activities

SSA and NINO

June 14, 2014 · Leave a Comment

NINO 3 is a measure of El Niño/La Niña (ENSO) intensity. It’s often said that ENSO has a period of 3-7 years. Why is it so hard to identify a single period? This is a job for SSA!

ninoscree

The scree plot shows that there are a ton of significant eigenvectors– this is a very complicated signal– but I want to focus on the first four, which are a shade more significant than the rest. They come in two pairs, which for SSA means that they represent two sinusoids. Here are the eigenvectors.

ninovects

How well do these two capture the ENSO signal?

ninossar

Not great, but it gets most of the ups and downs. Just not the peaks.

So what are the periods of these two? The first two are at 5.8 years, and the second two at 3.5 years. To note: those are relatively prime, so the two frequencies are always going to be going in and out of sync. So it’s not so much that ENSO has a clear frequency (it doesn’t), nor that that frequency is 3-7 years (because what would that mean anyway). It has two main frequencies, like a dial tone.

→ Leave a CommentCategories: Research

A Foundation for Environment Science

June 13, 2014 · Leave a Comment

A team of us students in the sustainable development program are trying to revamp our core science course. For a group of mathematically sophisticated, intellectually bold, and cutting-edge-research-focused people, our current “introduction” to science is far too lax and disorganized. We want to put it on surer ground.

The class needs to go into quite a few topics; minimally, it needs to include climate, hydrology, ecology, and public health. Disasters, energy, rocks and soils, and agriculture would be nice too.

The goal of the class is to prepare us to struggle through any sequence of PhD-level classes in a science of our choice, and to let us engage academic papers written by, well, anyone. The first response that we got from the Earth Institute post-docs, when we asked their advice, was that a class like this is impossible. But then, we’ve been doing exactly that with far worse for years.

We decided that we should start the first class with Thermodynamics, as a foundation for the rest. I’m in charge of writing up the topics for that day.  I think there are a few other pieces that are similarly foundational to all environmental science: dimensionality, stocks and flows, equilibria, industrial ecology, and path-dependence.  I’m not sure how it all fits together, but here’s what I’ve got so far.

Dimensionality

  • Pi-Products

Thermodynamics

  • Foundations
    • Forms of Energy
    • Principle of least action
    • Lagrangian Dynamics
    • Noether’s Theorem
    • Path-dependent derivative
  • First Law
    • Energy Conservation
    • Thermal energy and temperature
    • Thermal energy transfer
    • Temperature and phase changes
  • Second Law
    • Entropy
    • Equilibrium
    • Irreversibility
    • Fundamental Equation and its derivatives
    • Legendre Transforms
  • Terminology:
    • system, boundary, environment, primitive properties, derived properties, thermometric temperature, event interaction, adiabatic, diathermal, phase, restraint, thermodynamic processes, path and state
    • open, closed and isolated system
  • Topics to leave out:
    • Enthalpy, work, 3rd law of thermo

Stocks and Flows

  • Industrial Ecology
  • Emergy

→ Leave a CommentCategories: Teaching

Chasing Fish

June 11, 2014 · Leave a Comment

For the EI retreat recently, for one of three short videos I generated for my presentation, I converted my code for the “Distributed Fishery Commons”, an simple ABM, to 2-D. Each dot in the video is a virtual boat, fishing down a path in its wake. The boats never directly interact, other than to not fish at the same location. They just move to where they see the most fish, and the result is an intricate dance or bouncing around. Take a look:

→ Leave a CommentCategories: Research