James A. Rising

Science 2.0

June 9, 2014 · Leave a Comment

Science is constantly changing– we’re generating new data and developing new models faster than we can understand how they should all fit together.

My tool, the Distributed Meta-Analysis System, is ready to go, and I want to write more about it. But I also want to point people to two other interesting projects that seem to be trying to make science work better:

The Open Science Framework is trying to get people to make their data and papers and science, in general, available for all.

Curate Science is trying to solve the replication problem, encourage people to post their replication results and identifying needs.

For me, this is also about what might be called “Evolutionary Modeling”: modeling as a social and ongoing endeavor, involving many groups and combining their results in institutional ways. Science 2.0 is coming.

→ Leave a CommentCategories: Research

Impulse Responses to ENSO

June 7, 2014 · Leave a Comment

El Nino and La Nina affects crops in a lot of different ways. I’ve been looking at the response of agricultural yields over time to an ENSO event, where, depending on the dynamics of the social-natural system, impacts could persist for years after the impact or even emerge before the impact.

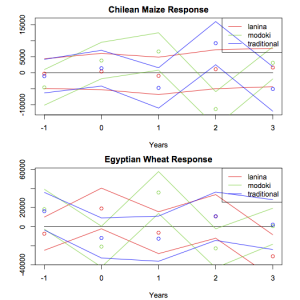
Here’s what country-wide production look like, in this impulse response framework. Neither Chile nor Egypt show a response to La Nina, but they both have strong responses (which appear to oscillate) to Modoki El Ninos.

country-response

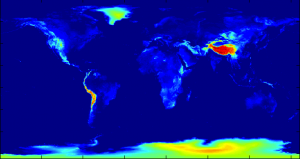
The map below shows areas where Maize is grown (anywhere but black). Areas in white show no significant response from ENSO. Colored areas deviate from grey in three bands: red for a response to traditional El Ninos, green for a response to Modoki El Ninos, and blue for La Ninas.

yieldcorr

→ Leave a CommentCategories: Research

Grain-Weighted Elevation Map

March 9, 2014 · Leave a Comment

Elevation can be an important variable to consider, but the elevations represented in a digital elevation model (DEM) might not correspond very well to those that impact people. Agriculture can be a good proxy for where people are.

First, I generated a .5x.5 degree map of where grains are grown (barley, maize, millet, rice, sorghum, soybeans, and wheat). Then I used it to generate a .5x.5 degree DEM, based on GLOBE, where the elevation of each grid cell is a average of the elevations available in the finer resolution of GLOBE, weighted by the area of grains grown in the coarse pixel.

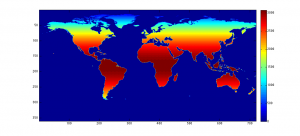
Here’s an image of the DEM. Download the 360×720 CSV.

avg_elev_50

→ Leave a CommentCategories: Data · Research

Tools for Analyzing the EM-DAT Disaster Database

February 15, 2014 · Leave a Comment

The CRED EM-DAT database is a collection of information about disasters, which you can search and download. However, the form that its provided in can be inconvenient for immediate cross-country analysis. Here you can download it as a spreadsheet (along with the requisite agreement).

Given the unreliability of this data, sometimes the best analysis is the simplest. But I made three tools for some additional work. These are MATLAB functions, and the first step is to export a subset of the data as a csv, with the date columns formatted as numbers.

Simple plotting of EM-DAT totals (with running average): download zip

Plotting the probability of disasters of a given size: download zip

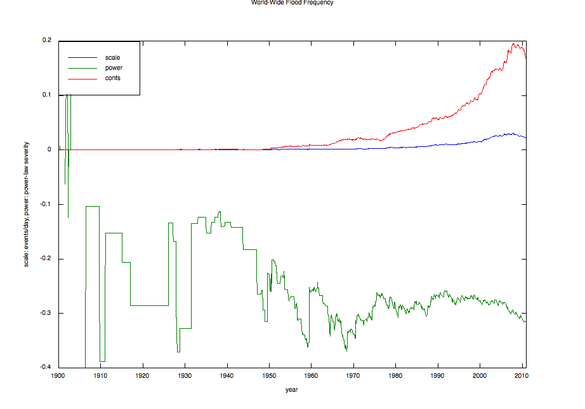
Attempt to find a power-law in disasters frequencies (changing in time): download zip

→ Leave a CommentCategories: Data · Research

Land Area by Grid Cell

January 25, 2014 · Leave a Comment

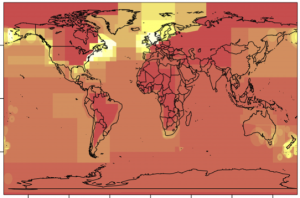
I use global data along a latitude-longitude grid fairly frequently. That can distort land areas pretty severely, but often that’s not a problem, if the data in question doesn’t scale with land area. But when it does, you need a new denominator. Here’s a dataset for that case.

landarea

It’s a .5 degree gridded dataset of land areas. For grid cells that are completely on land, that’s just a function of the latitude. On the coasts, I use a higher-resolution map of the coast contour to figure out how much land is in each cell. The values fluctuate a little artificially, because of how everything is calculated, but it’s generally within 1% of the correct value.

Download it here: 720×360 CSV

→ Leave a CommentCategories: Data

The Logistic Map in Action

January 24, 2014 · Leave a Comment

Everyone’s heard of the logistic map:
x_{n+1} = r x_n (1 - x_n)

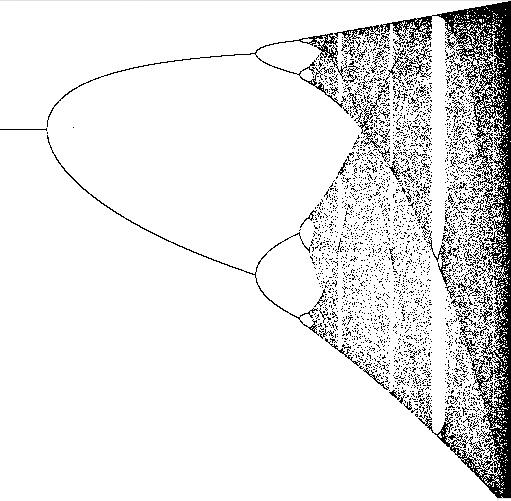
It’s elegant, it’s powerful (a classic for modeling ecosystems, e.g.), and it’s incredibly chaotic. As you change r, its internal frequency doubles, and then redoubles over a shorter span, and then again and again, until it reaches an infinity frequency over a finite distance. So you get beautiful fractal pictures like the following, bursting with internal structure:
Static Logistic Map

But they rarely tell you how you get the picture, or what it means. The closest you get is that these are “asymptotic” values– a meaningless statement for something that never settles down.

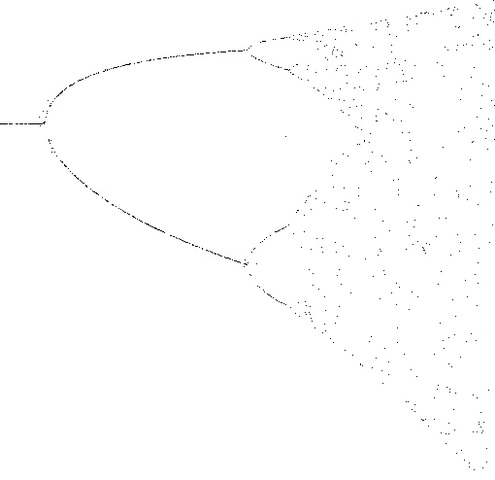
So, I made an animation. In it, I just keep adding new points, each with a value of r and an initial value of x, and let them fly.


logistic

→ Leave a CommentCategories: Research

RAM Legacy Geography

January 22, 2014 · Leave a Comment

As part of my Marine Protected Area analysis, I constructed spatial boundaries for the data in the RAM Legacy database, a global database of stock assessments.

ramgeo

A dropbox with the spatial regions is available here:
The contents are as follows:
  • latlon.csv: The “raw” data, with an encoding of the polygons for each RAM region
  • reglocs.csv: Area and centroid location for each region
  • shapes/ram.*: A shapefile for the RAM regions (polygons map to lines in latlon.csv)
  • load_areas.R: A bunch of useful functions for interpreting the data in latlon.csv
  • genshape.R: The code that generated the shapefile from latlon.csv
  • From Boston Presentation.pdf: The relevant slides from the Boston presentation
  • fa_/ and kx-nz-fisheries-general-statistical-areas-SHP/: FAO and New Zealand fishing area shapefiles
I just generated the shapes/ram shapefile, and I haven’t figured out how to label each of the shapes its RAM region yet, so you just have to look in latlon.csv for the association.

A working paper of the project this was for is posted here: http://ssrn.com/abstract=2380445

The discussion of the geocoding of the RAM database is in the first appendix (which is just tacked on to the end of the paper).
You are welcome to use this data, but please cite that paper.

→ Leave a CommentCategories: Data

Meta-Analysis Tool at AGU

December 12, 2013 · Leave a Comment

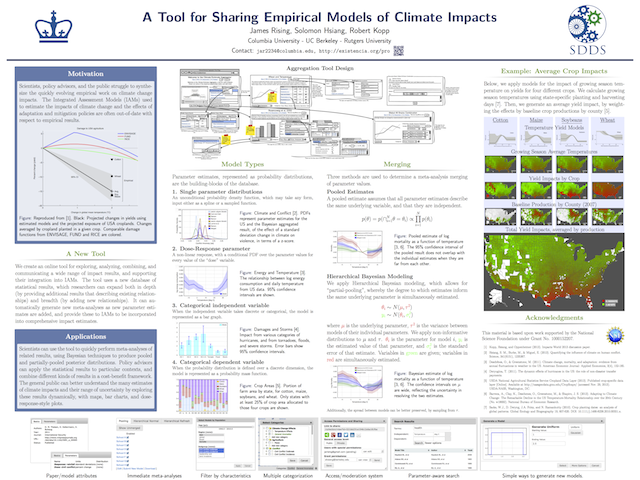
My second poster at AGU is on work with Solomon Hsiang and Bob Kopp, describing a new tool for comparing empirical results and performing meta-analyses. We are currently aiming the tool at climate impacts, but hope to expand its use to other fields.

AGU Poster

If you would like to try out the tool, go to the Alpha Testing Site.

→ Leave a CommentCategories: Research · Software

Agriculture and Conflict at AGU

December 9, 2013 · Leave a Comment

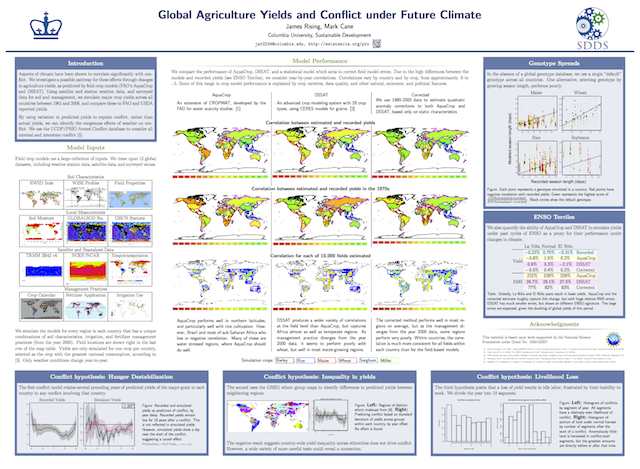
I have a poster at AGU presenting my work with Mark Cane on using process-based crop models to predict agricultural yields, and then using those predicted yields as exogenous variation to predict conflict.

AGU Poster

(The poster is big: try looking at the lower resolution PNG version if you have trouble.)

Additional material is available in several forms, but the most fully consolidated form (focused just on the yield results) is this document which I brought to the AgMIP conference in NYC last month: AgMIP Summary.

→ Leave a CommentCategories: Research

Multi-Level Governance in Fisheries

February 7, 2013 · Leave a Comment

Here’s a draft of the short talk I gave at the Multi-Level Governance plenary at the Earth System Governance Tokyo Conference:

Fisheries are an ideal example of the need and potential for multi-level governance.  For decades, governments have struggled with overfishing and degradation of marine and inland waters.  Small fishing communities, fish stocks and food chains, factory ships, and policy-makers all act on different scales.  The various components of fisheries policy—gear and catch restrictions, protected areas, and monitoring—also act on idiosyncratic scales.

Despite decades of experience, fish stocks continue to collapse.  This is the consequence of multi-level complexity, and in many ways, the result of a deep tragedy of the commons, playing out across scales and across boundaries.  Fisheries are constantly confronted with multi-level issues: multiple stressors, from acidification to invasive species; environmental and human variability; cross-scale issues driven by the scale of fish ranges, environmental forcing, and foreign fleets; and failures of traditional management.  Governance of fisheries that is focused on a single scale cannot effectively manage resources that have their dynamics playing out on multiple levels and multiple scales.  Fishery contexts have many of the characteristics that make commons management difficult: ownership rights are weak, dynamics are unpredictable, stocks are mobile and widely dispersed, and outside pressures are strong.  Many effective traditional management practices fail when confronted with modern demands.  These are many of the same problems confronted in other areas of sustainable development, for example around climate change, water use, and biodiversity loss.

However, multi-level governance exposes possibilities for management that do not exist at any single scale.  The basic approach in fisheries multi-level management is called “co-management”: regional and national government acts on a large scale with policies explicitly designed to support local fishing communities acting on small scales.  The effective functions of large-scale government include monitoring of fish stocks, setting targets and allotments, identifying ecosystems for protection, enforcing boundaries, capacity building and legitimization, and facilitating communication across boundaries.  The local management level, then, is free to ensure fair fishing practices, coordinate amongst stakeholders, identify community needs, and monitor fisherman compliance and boundaries.

More generally, the fishery is an example of a multi-level commons, and I think that many of the lessons from fisheries are applicable to other commons.  The potentials for management in the multi-level commons are greater than the traditional commons in a number of ways.

First, regime shifts, and tipping points and resilience, are concrete, measurable phenomena.  We see them all the time in fisheries, and they manifest in multi-scale ways.  They can be very difficult to reverse, but sometimes they heal far better than we could expect when allowed the room to do so.  Strong management can ensure sustainability—we see it in some of the fisheries in California and elsewhere.

Second, uncertainty and unpredictability are a norm of fish ecosystems, and the multi-scale perspective will not diminish that problem.  We need robust institutions that can coexist with chaos and catastrophe.

Third, in multi-level situations, spatial organization matters.  Models that ignore spatial structures, spatial heterogeneity, spatially-mediated resilience, neighborhood effects and teleconnected regions typically miss important dynamics.  Policies that do not support spatial choices or recognize the importance of spatial arrangements can miss important opportunities.  Key dynamics play out differently in different areas, and how areas interact with each other is important for governance.

Fourth, boundaries within multi-level environments are not predetermined and where they are drawn can make a huge difference.  The divisions that seem natural at one scale can be integral components of another scale, which highlights the opportunities to make important choices.  Boundaries create institutions, and they can be formed to delineate groups with common interests and or areas with coherent dynamics.  Boundaries allow groups the space to self-organize local institutions.   Boundaries can carve out healthy areas to be maintained, which, through cross-boundary effects, can support sustainability throughout a region.

The construction of institutional boundaries and other government policies has also been at the heart of much harm in fishery commons, by undermining traditional regimes.  The process of boundary construction needs to be married to a deep political process that engages both stakeholders and scientists.

Fifth, cross-boundary effects are the norm in multi-level commons.  Whether they are in the form of the benefits beyond boundaries of protected areas, or cross-boundary pollution, or the impact of exploitation of resources on scales greater than that of a given community, when a commons is situated within a large area, the larger scale dictates the constraints of the local commons.

A wide range of empirical questions remains to be addressed, but there are two challenges that ahead that are most central.  First, we need to better understand how multi-level and multi-scale perspectives can be incorporated into our quantitative models, to form new techniques of asking multi-level research questions, and to bring those results into the policy realm.

Second, inequality is a core factor and a key challenge for multi-level governance.  The history of local fisheries management is centered around transfers of power, often across levels of exploitation—either through centralization, or to the much larger players that come with greater market forces.  Early critiques of the privatization of the commons focused on the inequality that it created.  The measurement of success in fisheries—whether by maximum yield or maximum economic benefit—is politically charged.

I recently attended a talk by E.O. Wilson, where he gave “Wilson’s Law”: “If you save the living environment, the biodiversity that we have left, you will also automatically save the physical environment too. But if you save only the physical environment, you will ultimately lose both.”

We need to find a place in our world for healthy relationships with our ecosystems and the people who rely on them.  Thank you.

→ Leave a CommentCategories: Essays